A Half-Century of Change on Route 29
By Jock O’Connell, PMSA West Coast Trade Report
A recent spasm of housecleaning turned up a dusty cardboard box stuffed with paraphernalia from fifty years ago. It was a proverbial time capsule. Aside from a number of truly epic grad school bar receipts, the contents included reams of dissertation research notes, a copy of a U.S. Maritime Administration report on containerized cargo in 1973, and a letter from my draft board advising me that they had deemed me ineligible for a government-sponsored tour of Vietnam.
Why I had hung on to the bar tabs may be only slightly less puzzling than why I still have the MARAD report. But, since it is now again in hand, let’s see what it tells us about the changes that have occurred in the nation’s box trade over the past half-century, especially with the Republic of Vietnam.
One huge difference between then and now was that America actually ran a trade surplus in 1973, with $71.314 billion in merchandise exports more than balancing out the $69.121 billion in goods we imported. That was more or less reflected in the nation’s containerized trade, which amounted to 17.2 million long tons of cargo carried in 1,398,000 loaded containers. (MARAD would not begin using the TEU or twenty-foot equivalent unit to enumerate container trade until 1978.) 48.8% of those boxes were outbound and 51.2% inbound.
Perhaps even more remarkable was that U.S. flagged carriers handled 33.4% of all that container traffic, with Japanese shipping lines handling another 14.4%.
The busiest trade routes fifty years ago were those linking America’s East and Gulf Coast ports with Europe and the Mediterranean. Altogether, 662,000 containers crossed the Atlantic in 1973. By comparison, the transpacific trade amounted to 564,000 containers.
MARAD identified three transpacific shipping lanes, the most prominent of which was designated as Trade Route 29. It linked U.S. Pacific Coast ports with the Far East. In 1973, 377,000 containers were shipped via TR 29. Of those, 195,000 were inbound and 182,000 were outbound. Another 135,000 containers sailed that year along Trade Route 12 between East and Gulf Coast ports and the Far East by way of the Panama Canal. 82,000 of those containers were inbound, while 53,000 were outbound. In addition, 52,000 containers, with 22,000 inbound and 30,000 outbound, were shipped along Trade Route 16 between East and Gulf Coast ports and Australasia via Panama.
Altogether, U.S. container trade along those three transpacific routes in 1973 amounted to 564,000 boxes, of which USWC ports held a 66.8% share.
Given the volumes crossing the Atlantic, it’s not surprisingly that “America’s Port” was then the Port of New York/New Jersey with 523,000 containers. It was followed at some distance by Los Angeles (147,000 containers) and then by Norfolk (96,000), Baltimore (95,000), Oakland (83,000), Seattle (76,000), Long Beach (61,000), Philadelphia (36,000), Charleston, (32,000), and Houston (31,000). Savannah, today one of the nation’s busiest container ports, processed 19,000 containers in 1973. The Port of San Francisco, which was still then in the container business, handled 67,000 containers. MARAD did not break out the volume of box trade through the Port of Tacoma, but it did report that the Port of Portland (Oregon) moved some 20,000 containers.
Some things have not much changed, though. Then and now, containerized trade largely involved imports of industrial goods and consumer items and exports of agricultural produce and raw materials. Motor vehicles and parts, telecommunications apparatus, iron and steel plates, fresh or slightly preserved fish, and clothing were the major commodities in the inbound transpacific trade. Waste and scrap paper, animal feed, wheat, cotton, and wood in the rough were the leading containerized export commodities.
Other than the enormous increase in the volume and value of our containerized trade with East Asia over the past half-century, the most conspicuous change involved the cast of trading partners.
U.S. trade statistics fifty years ago did not feature even cursory data on trade with China, then caught up in a catastrophic cultural revolution. Japan was America’s largest Asian trading partner. Not just that, many analysts expected Japan to ultimately overtake the U.S. as the world’s largest economy. Treatises explaining how the soundly defeated World War II foe could so quickly reverse the table, at least economically, filled bookstore shelves in the 1970s and 1980s. Today, scarcely anyone in official circles worries about Japan as a serious challenger to America’s economic supremacy. That role has instead been handed to China.
Contemporary U.S. trade statistics date back to 1985. (Changes in data collection methodologies make looking further back a dubious exercise.) Still, just five years after the initiation of Deng Xiaoping’s economic reforms, Japan’s $94.41 billion in two-way trade with the United States in 1985 easily eclipsed our $7.72 billion in trade with China.
As a boomer who grew up in the shadow of the draft, I came to have mixed views of Vietnam. After all the rhetoric about falling dominoes, two manifestations of the “triumph of communism” impressed me during a visit there a few years back: the bronze bull in front of the stock exchange in Hanoi, and the local teenagers who were using a monument honoring V.I Lenin as a skate board park.
The U.S. Census Bureau’s Foreign Trade Division didn’t begin publishing data on trade with Vietnam until 1992, when the value of two-way trade amounted to all of $4.6 million. It didn’t cross the billion-dollar mark until 2000. Last year, though, Vietnam nearly overtook the United Kingdom as America’s seventh largest trading partner. As a source of America’s containerized imports, Vietnam now ranks second only to China in terms of both tonnage and value.
Although China is and will likely remain the dominant force in East Asia, Vietnam’s rise has been astonishing. Over the past twenty years, while U.S. containerized import tonnage grew by 87.5%, import tonnage from Vietnam soared by 1780.8%.
How Vietnam’s exports get to U.S. markets offers a microcosm of the trends that have affected transpacific trade.
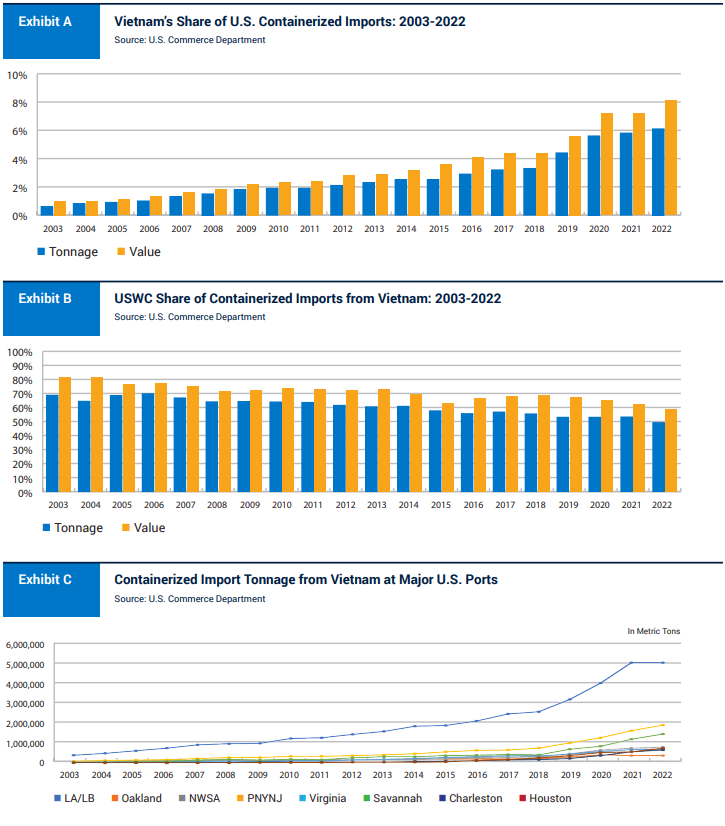
Just twenty years ago, Vietnam accounted for a reedy 0.6% share of all containerized import tonnage offloaded at U.S. mainland ports. That volume represented just a shade over 1.0% of the $353.25 billion in America’s containerized import trade that year. By last year (2022), the Southeast Asian country’s share of the trade had increased to 6.1% in terms of tonnage and 8.1% in terms of value, as Exhibit A indicates. We now import more containerized merchandise by sea from Vietnam – in terms of both tonnage and value — than from any other country in the world except China. Twenty years earlier, Vietnam ranked 35th in tonnage and 17th in value.
The routes Vietnam’s containerized exports take to U.S. markets have shifted over the past two decades. Twenty years ago, 68.7% of the import tonnage went through U.S. West Coast ports, but, as Exhibit B reveals, the USWC share has been in almost steady decline (to 49.2% last year) as other ports on other coasts vied for greater pieces of the trade.
As Exhibit C shows, all of the major U.S. ports have seen their containerized imports from Vietnam grow in the past two decades. Nationally, containerized imports from Vietnam increased from 693,157 metric tons of cargo in 2003 to 13,036,930 metric tons in 2022. The San Pedro ports remain the principal gateways for containerized goods entering U.S. mainland ports from Vietnam. But, while tonnage has grown from 395,245 metric tons in 2003 to 5,081,116 metric tons last year, the two ports’ combined share of the trade has slipped from 5 .2% to 39.3%. Remarkably, the portion of the trade through the Northwest Seaport Alliance ports has remained stable, 6.3% in 2003 and 6.4% last year. The Port of Oakland, however, has seen its share of the trade slip from 4.6% in 2003 to 2.9% in 2022.
Savannah, with its share rising from 3.2% to 11.3%, showed the sharpest increase. Other ports seeing their share of the business grow are Houston (0.7% to 5.8%), Charleston (2.4% to 5.0%), the Port of New York/New Jersey (13.5% in 2003 to 15.0%), and Norfolk (4.9% share to 5.6%).
Finally, did I mention the Vietnam War’s crucial role in promoting the use of containers to ship goods around the world? Marc Levinson’s history of the maritime container trade, The Box, contains a entire chapter about how the U.S. Navy’s Military Sea Transportation Service came to hire Malcom McLean to help sort out the logistics of supplying the buildup of American forces in Southeast Asia only a decade after McLean shipped his first container. It’s a great read.
++++++++++