
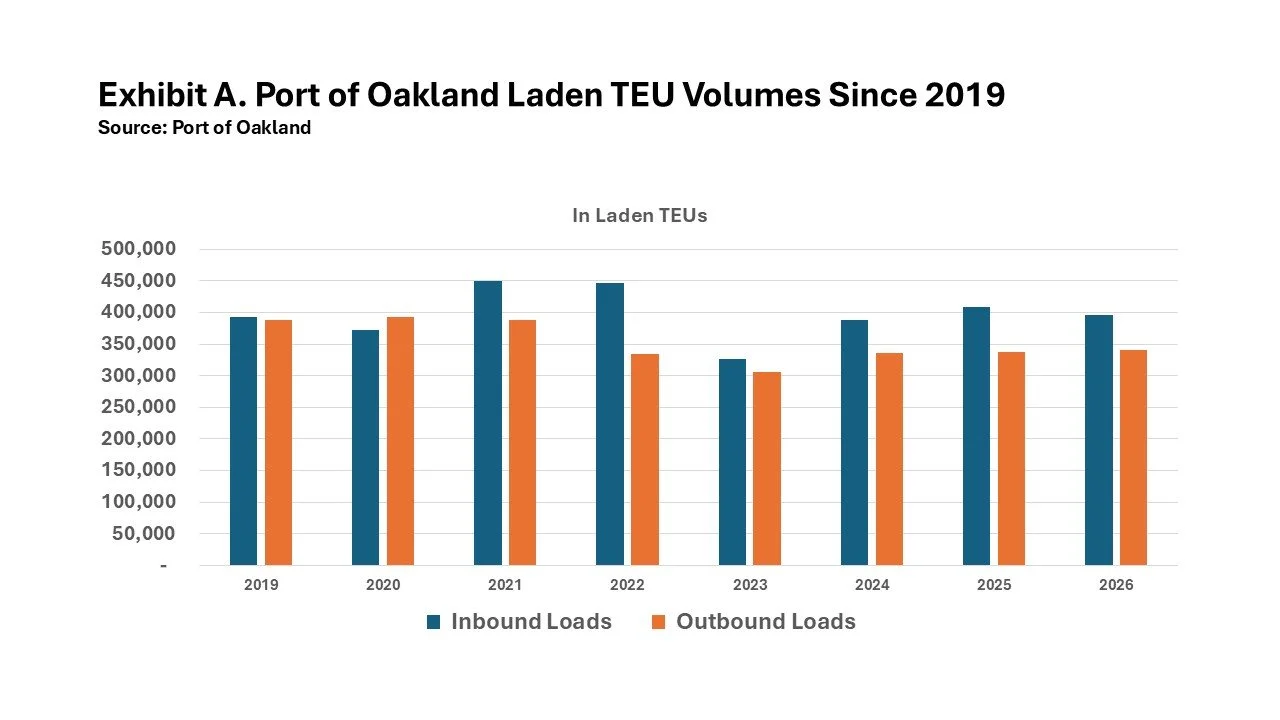
Here are a series of graphs displaying loaded TEU volumes at key ports.
Exhibit A displays the laden inbound and outbound container traffic at the Port of Oakland through the first five months of each year since 2019. The port discharged just 2,494 more loaded TEUs this year than in the same period seven years ago, a gain of 0.6%. Meanwhile, 12.5%.fewer loaded TEUs were shipped from the Northern California port.
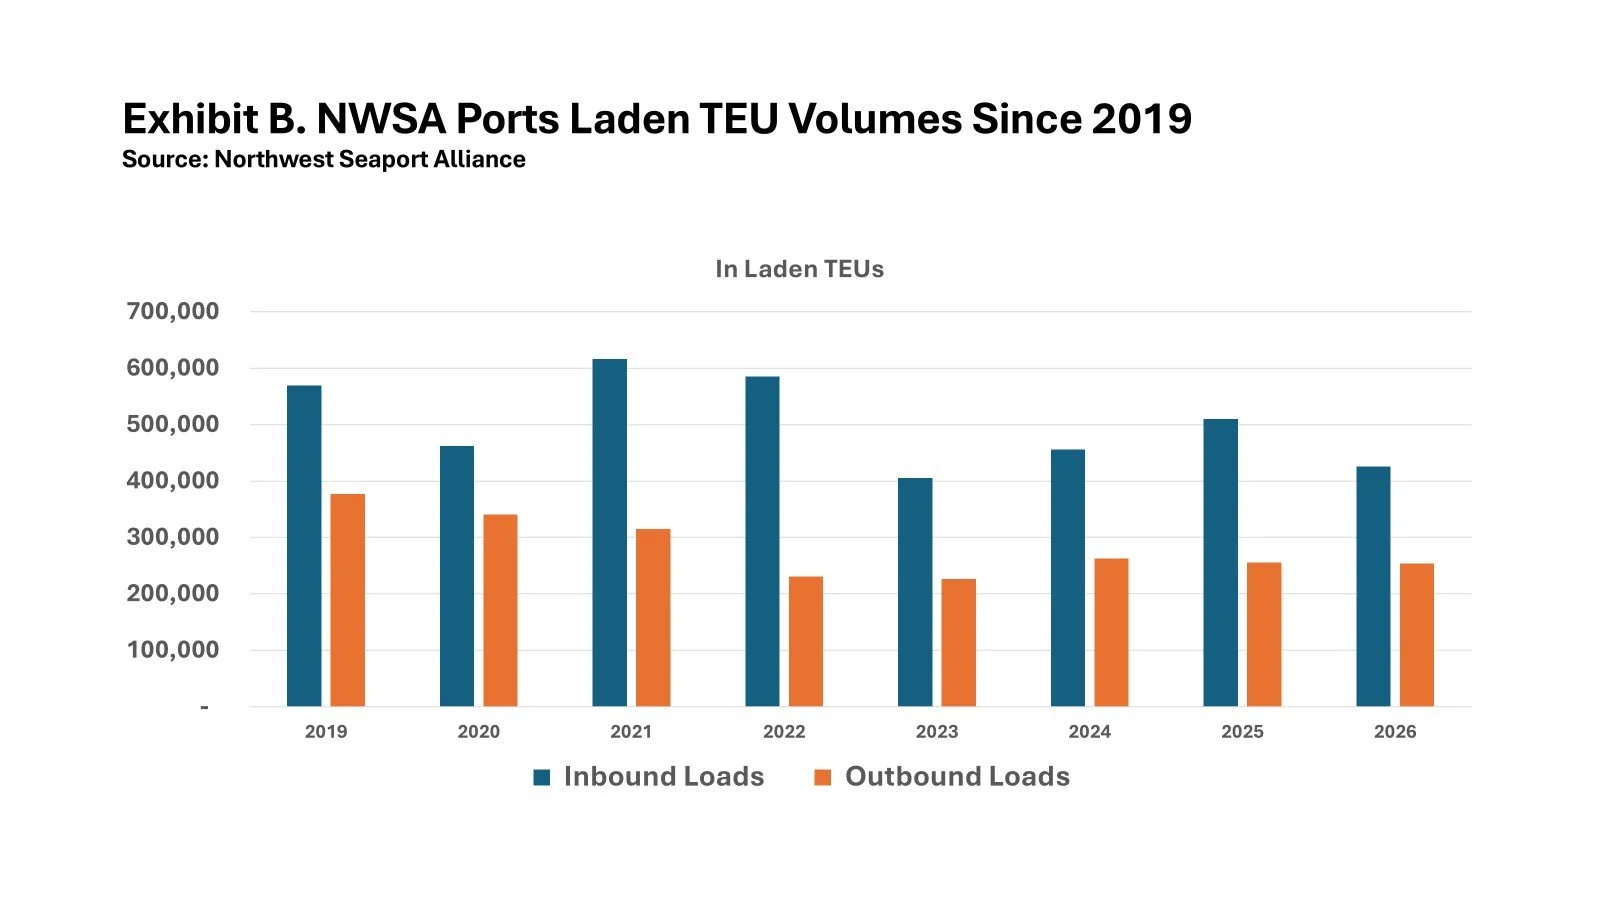
Exhibit B shows the laden TEU volumes in the January-May period in each year since pre-pandemic 2019 at the Northwest Seaport Alliance. In the first five months of this year, the Ports of Tacoma and Seattle collectively handled 143,937 fewer inbound laden TEUs than they had in the same period before COVID, a fall-off of 25.3%. Similarly, outbound loads this year have fallen off by 123,580 TEUs or 32.8%.
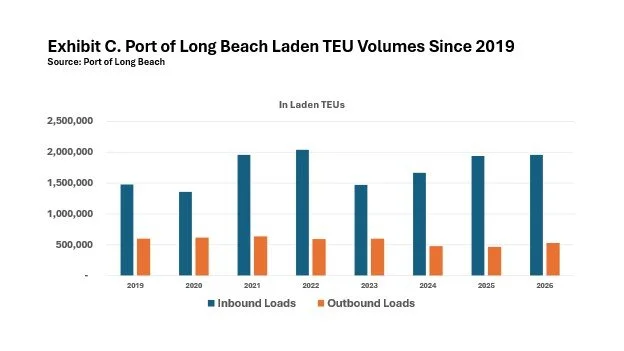
Exhibit C considers the Port of Long Beach, where inbound loads have increased by 478,783 TEUs since 2019, a gain of 32.3%. Outbound loads, however, have decreased by 68,869 laden TEUs or 11.5%.
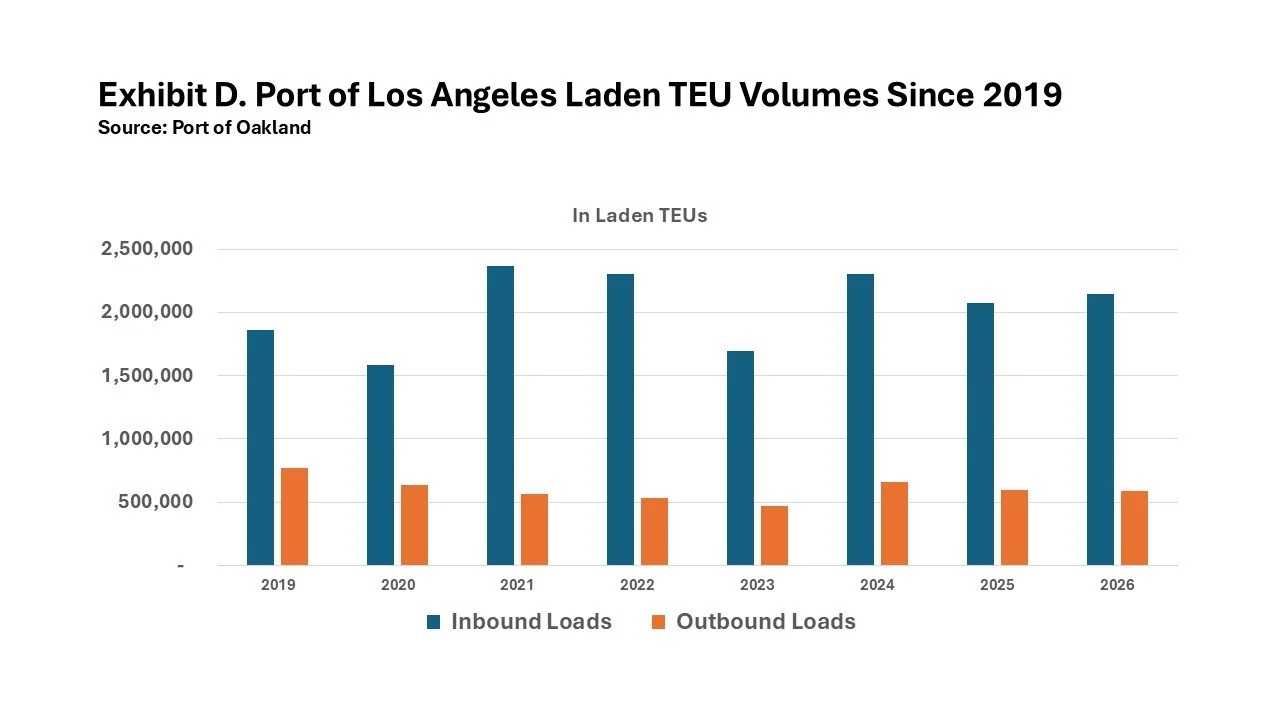
Exhibit D focuses on the Port of Los Angeles, normally the nation’s busiest container port. In May of this year, the San Pedro Bay facility handled 281,374 more inbound laden TEUs than it had in the first five months of 2019, a gain of 15.1%. Outbound loads were fewer by 180,920 TEUs, a drop of 23.5%.