
Although TEUs are the metric most commonly used in describing containerized trade, here we present the shares of America’s box trade in terms of the declared weight and value of the merchandise being conveyed in all of those TEU.
The latest foreign trade statistics from the U.S. Commerce Department show that USWC ports remain a dynamic link in global trade. May saw significant year-over-year bumps in the PORTS’ collective share of the nation’s container import and export trades. Conventional wisdom is that Importers have been aggressively frontloading peak season orders so as to get inbound shipments onshore and past the Customs shed before the next wave of tariffs hits in August. Because expediting shipments from abroad and mainly from East Asia usually involves minimizing the number of days laden containers are at sea, frontloading typically results in a surge of container traffic through U.S. West Coast ports.
So it is that the numbers in Exhibit 4 describe a sharp year-over-year jump in the percentage of containerized imports moving through the nation’s Pacific Coast ports. At the same time, Exhibit 4 also reveals that maritime trade on the West Coast continues to shift to the Ports of Los Angeles and Long Beach in Southern California. May saw the percentage of the nation’s containerized import tonnage through Los Angeles and Long Beach rose by 2.9 percentage point from a year earlier, while the percentage of containerized import tonnage through Oakland and the NWSA ports declined.
Longer term, the two Southern California ports saw their share of containerized import tonnage slip from 27.6% in May 2019 to 26.4% this May, while the combined market share held by the Port of Oakland and the Northwest Seaport Alliance Ports of Tacoma and Seattle declined from 10.6% in May 2019 to just 6.5% in May 2026.
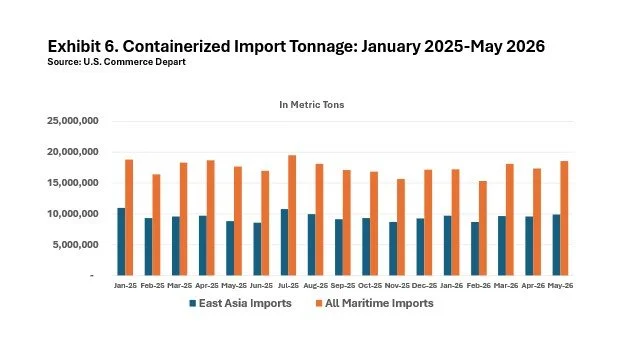
Exhibit 5, which focuses on America’s containerized trade with the markets of East Asia, tells a similar story. Importers anxious about impending tariff increases have accelerated their orders, leading to a sharp influx of cargo through the San Pedro Bay maritime complex. However, the Port of Oakland and the NWSA Ports of Tacoma and Seattle saw no gain in market share of containerized import tonnage from East Asia. In value terms, Oakland’s gain was more than offset by NWSA’s decline.
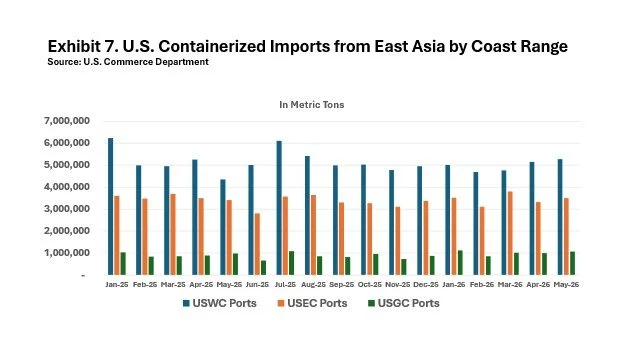
Exhibit 6 displays East Asia’s share of the containerized import trade since January 2025, when President Trump was sworn in for a second term.
Exhibit 7 then breaks down how the inbound trade has been distributed among ports in the three coastal ranges.
Ex. 4 USWC Ports Shares of Worldwide U.S. Mainland Container Trade
| Shares of U.S. Mainland Ports Containerized Import Tonnage | ||||
|---|---|---|---|---|
| April 2026 | April 2025 | April 2019 | April 2016 | |
| USWC | 36.3% | 34.8% | 36.8% | 39.5% |
| LA/LB | 27.4% | 26.3% | 25.9% | 28.5% |
| Oakland | 3.3% | 3.0% | 4.0% | 4.1% |
| NWSA | 3.7% | 3.8% | 5.4% | 5.7% |
| Shares of U.S. Mainland Ports Containerized Import Value | ||||
| April 2026 | April 2025 | April 2019 | April 2016 | |
| USWC | 41.2% | 39.7% | 44.3% | 48.6% |
| LA/LB | 32.2% | 31.8% | 32.9% | 36.8% |
| Oakland | 3.1% | 2.6% | 3.6% | 3.6% |
| NWSA | 4.6% | 4.4% | 7.0% | 7.6% |
| Shares of U.S. Mainland Containerized Export Tonnage | ||||
| April 2026 | April 2025 | April 2019 | April 2016 | |
| USWC | 32.6% | 30.4% | 36.5% | 38.8% |
| LA/LB | 20.2% | 18.5% | 21.8% | 22.6% |
| Oakland | 5.6% | 5.6% | 6.3% | 6.2% |
| NWSA | 6.1% | 5.5% | 7.8% | 8.7% |
| Shares of U.S. Mainland Containerized Export Value | ||||
| April 2026 | April 2025 | April 2019 | April 2016 | |
| USWC | 26.9% | 26.9% | 32.5% | 33.3% |
| LA/LB | 17.9% | 18.1% | 21.8% | 22.4% |
| Oakland | 5.4% | 5.5% | 6.1% | 5.9% |
| NWSA | 3.3% | 3.0% | 4.2% | 4.6% |
Ex. 5 Major USWC Ports' Shares of U.S. Container Trade with East Asia
| Shares of U.S. Mainland Ports Containerized Import Tonnage | ||||
|---|---|---|---|---|
| April 2026 | April 2025 | April 2019 | April 2016 | |
| USWC | 53.7% | 49.9% | 57.4% | 61.6% |
| LA/LB | 43.6% | 39.6% | 44.4% | 48.0% |
| Oakland | 3.4% | 3.4% | 4.6% | 4.8% |
| NWSA | 5.3% | 5.8% | 7.9% | 8.2% |
| Shares of U.S. Mainland Ports Containerized Import Value | ||||
| April 2026 | April 2025 | April 2019 | April 2016 | |
| USWC | 62.6% | 58.8% | 65.9% | 69.7% |
| LA/LB | 50.8% | 46.5% | 51.7% | 55.2% |
| Oakland | 3.8% | 3.2% | 4.0% | 4.2% |
| NWSA | 6.7% | 7.7% | 9.6% | 9.8% |
| Shares of U.S. Mainland Containerized Export Tonnage | ||||
| April 2026 | April 2025 | April 2019 | April 2016 | |
| USWC | 54.6% | 54.1% | 58.1% | 63.0% |
| LA/LB | 34.6% | 33.0% | 36.3% | 38.7% |
| Oakland | 8.4% | 9.3% | 9.2% | 10.1% |
| NWSA | 10.4% | 10.4% | 12.5% | 14.1% |
| Shares of U.S. Mainland Containerized Export Value | ||||
| April 2026 | April 2025 | April 2019 | April 2016 | |
| USWC | 58.8% | 58.7% | 64.4% | 69.2% |
| LA/LB | 39.1% | 37.8% | 43.5% | 48.8% |
| Oakland | 11.0% | 12.1% | 11.1% | 10.4% |
| NWSA | 7.7% | 7.9% | 8.7% | 9.3% |