
Yes, We Have Bananas!
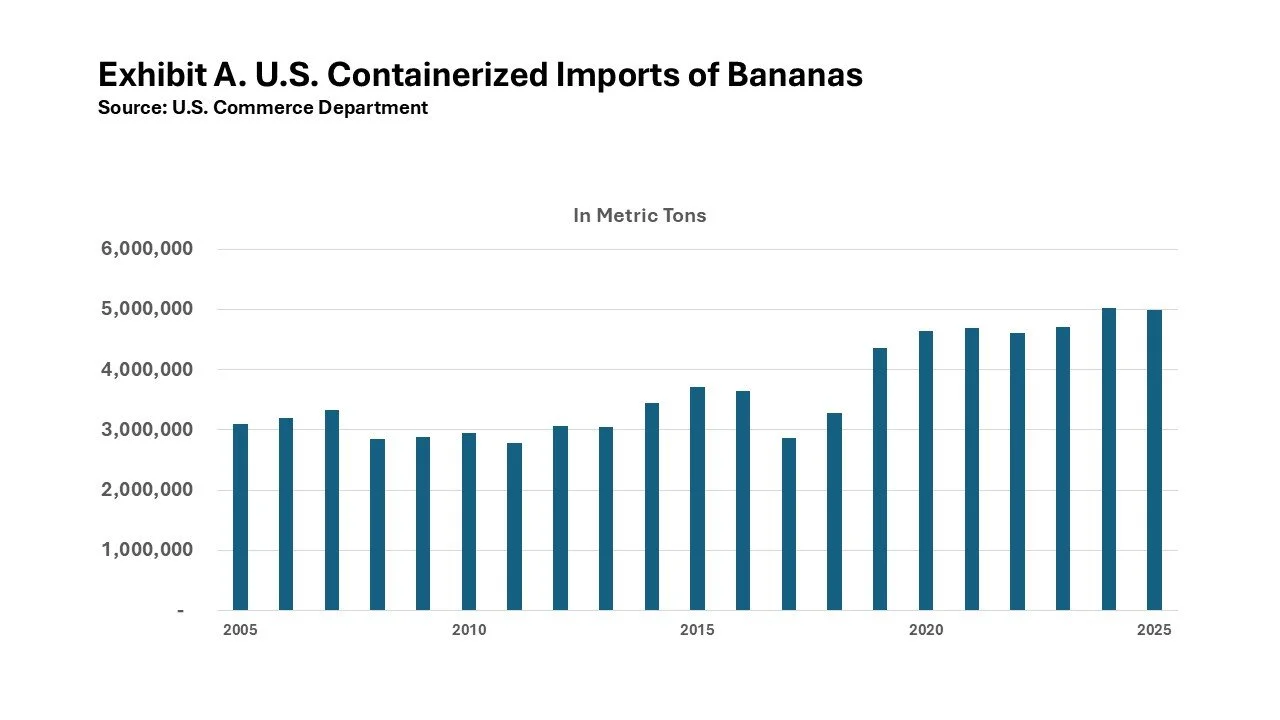
Last year, bananas ranked only behind Furniture and Automobile Parts in terms of the weight of containerized imports through U.S. seaports.
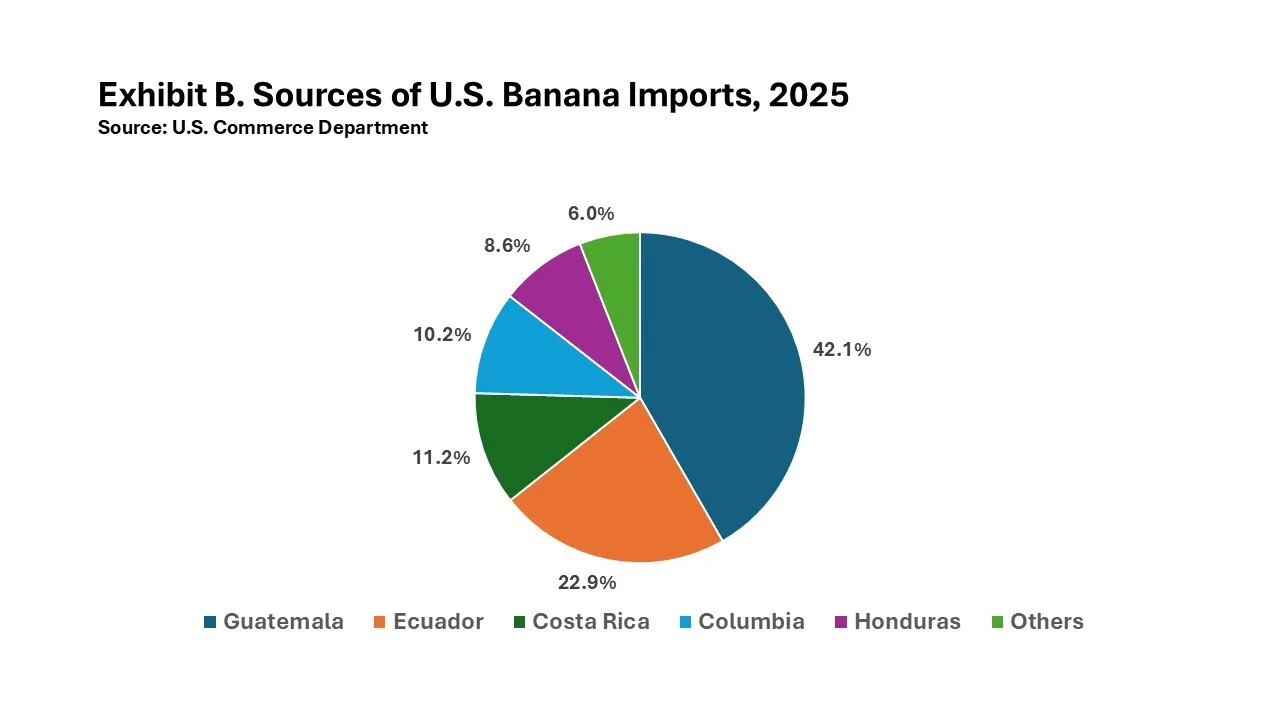
Nearly all bananas imported into the United States come from Central America, as Exhibit B shows.
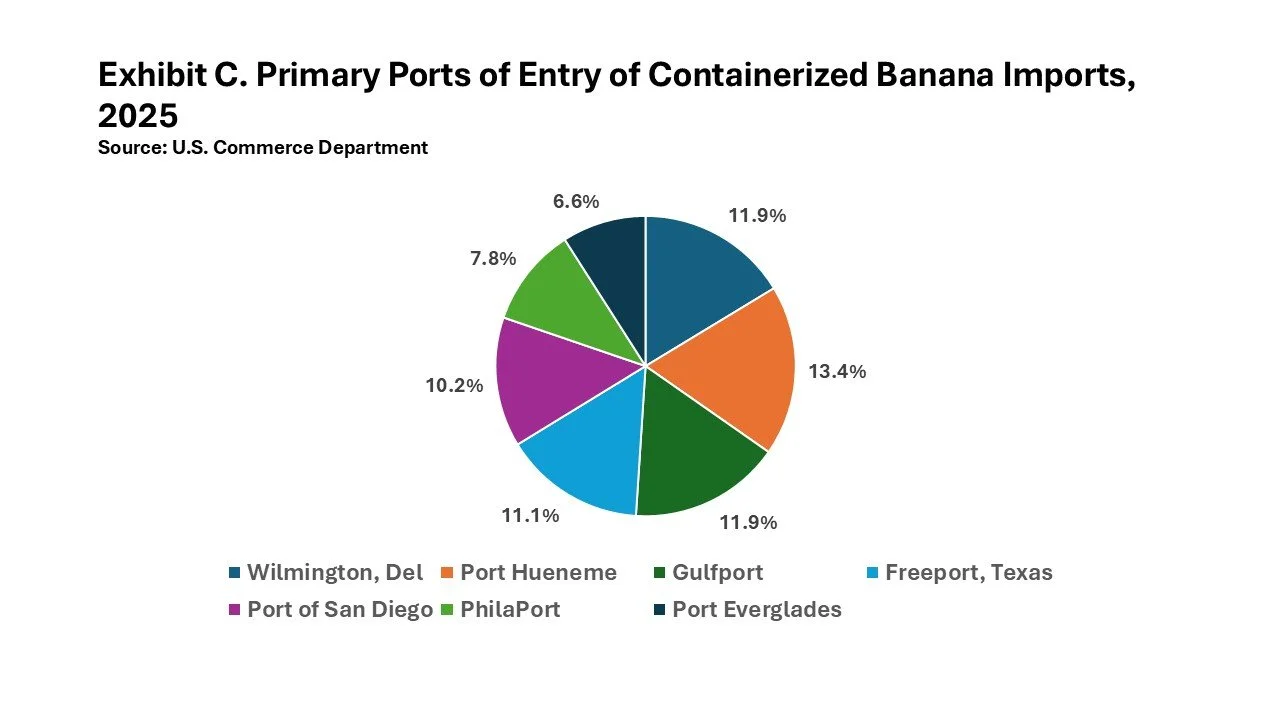
Last year, 87.8% of all banana imports arrived through the seven ports shown in Exhibit C.
Tree Nut Exports
Tree nuts rank among California’s top export commodities in value. Last year, almond exports were valued at $4.085 billion, while shipments abroad of pistachios and walnuts were worth $1.714 billion and $78 million, respectively. Apart from nuts sold to Canada and Mexico, most of the export trade moves by sea.
The 2025-2926 California Almond Crop Year concluded on July 31, with shipments abroad totaling 2.034 million pounds, an increase of 3.0% from 1.975 million pounds in the previous year. Exports accounted for 77.3% of all shipments in the past crop year. Exports to Asian-Pacific markets totaled 744.017 million pounds, down 1.8% from a year earlier. Shipments to Europe amounted to 681.201 million pounds, up 4.7% from the 2025-26 crop year. The 351.314 million pounds of almonds shipped to markets in the Middle East were up 3.1% from the preceding crop year. Exports to Canada and Mexico rose by 3.9% to 97.531 million pounds.
The 2025-2026 Crop Year for the Pistachio Industry ended on August 31, with 411,015 tons of exports. Exports accounted for 79.2% of all shipments. Exports were up 29.1% from the previous crop year but down 2.7% from the year before. Shipments to Europe rose 22.7% to 155.558 tons, while exports to Asia were up 18.3% to 147,459 tons.
The Walnut Crop Year runs through the end of August. Year-to-date data indicate a doubling of inshell exports, up 103.0% to 146,886 short tons. Exports of shelled kernels meanwhile rose 22.2% to 166,051 short tons. The Middle East/Africa accounted for the largest market for inshell walnuts, with shipments totaling 95,782 short tons, up 316.4% over the preceding crop year. Shipments of inshell walnuts to Europe declined by 3.1% to 28,227 short tons, while shipments to shelled walnuts to Europe rose by 29.8% to 96,060 short tons. 95.0% of inshell walnuts in the last year were exported, while just 61.8% of shelled walnuts were shipped abroad.
Washington State’s YTD Soybean Exports to China
The three grain shipping ports on the Washington State side of the Columbia River have been experiencing a substantial increase in soybean shipments to China from a year earlier. Through August, 3,567,602 metric tons of the valuable oil seed have been exported to the People’s Republic from the Ports of Kalama, Longview, and Vancouver. That represents a 232.5% year-over-year jump in trade.
Exports of soybeans to China through the Northwest Seaport Alliance Ports of Tacoma and Seattle have also been up so far this year, increasing by 164.8% to 556,535 metric tons. That gave the five Washington State ports a total of 4,124,096 metric tons of soybean shipment to China this year.
Nationally, U.S. oil seed exports to China have been up by 87.1% to 11,115,702 metric tons through August. The ports in the State of Washington accounted for 37.1% share of all U.S. soybean shipments to China in this year’s first eight months, up from a 29.4% share in the same period a year earlier.
Welcomed as these export gains are to soybean growers, the volumes are well below the number of tons of soybeans shipped to China in the same period in 2019, before COVID-19 roiled international trade and before tariffs became a favored tool of U.S. trade policy. Back then, U.S. soybean exports to China totaled 13,066,002 metric tons, with 6,268,046 metric tons shipped through the ports of Washington State, a 52.0% increase over the volume shipped to China through those five ports so far this year.
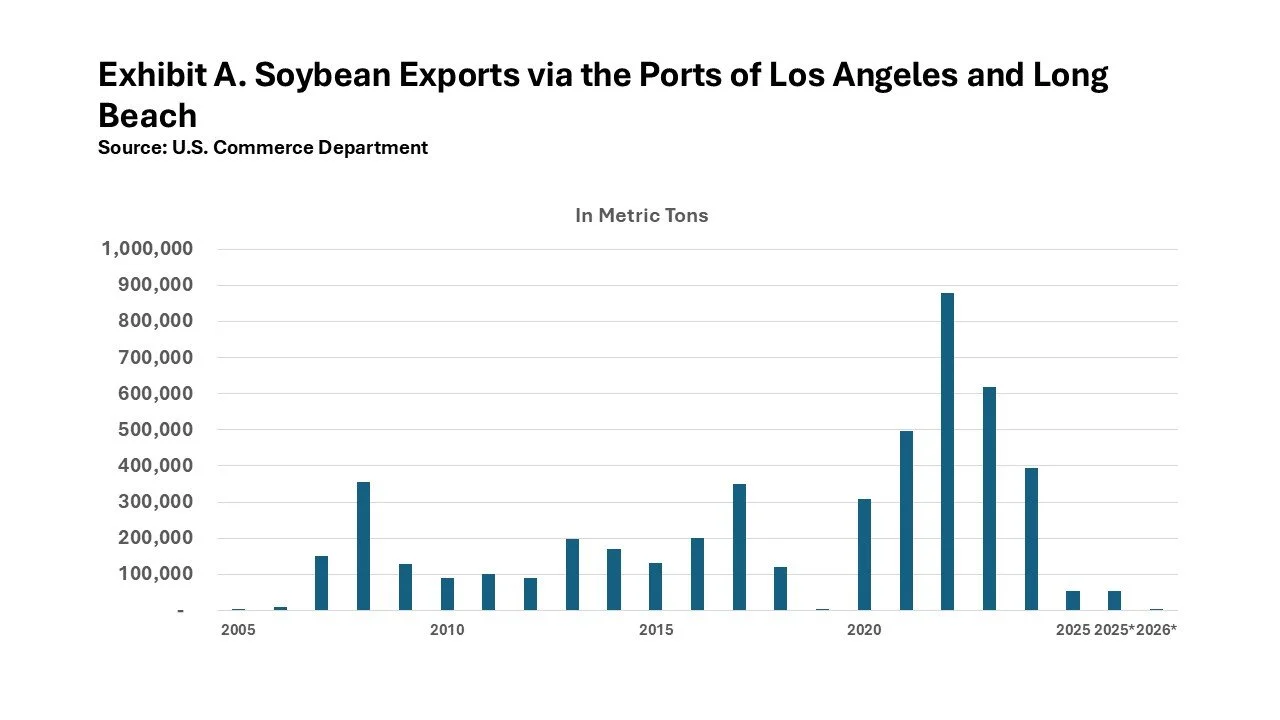
Apart from the 482 metric tons of soybeans that trickles through the Port of Los Angeles, no other West Coast ports have been involved in shipments of soybeans to China this year. Oddly, the Port of LA and its neighbor, the Port of Long Beach, formerly played a more significant role in America’s soybean export trade with China. As Exhibit A displays, the two Southern California ports handled significantly higher volumes of the trade during the period of pandemic trade disruptions earlier in this decade. (The comparable YTD figures for this year and last year are calculated on exports through August of each year.)