
August 2026 Container Traffic at North American Ports
August 2026 Snapshot
Analysts’ Forecasts for August TEU Tallies
On September 9, the National Retail Federation’s Global Port Tracker issued its estimate that the thirteen U.S. ports it monitors handled 2.29 million import TEUs in the month of August. That would represent a year-over-year decline of 1.3%. Meanwhile, the Descartes Systems Group estimated that 2,603,709 TEUs turned up at all U.S. ports in August, a 3.3% increase over last August.
What the Ports Are Reporting for August
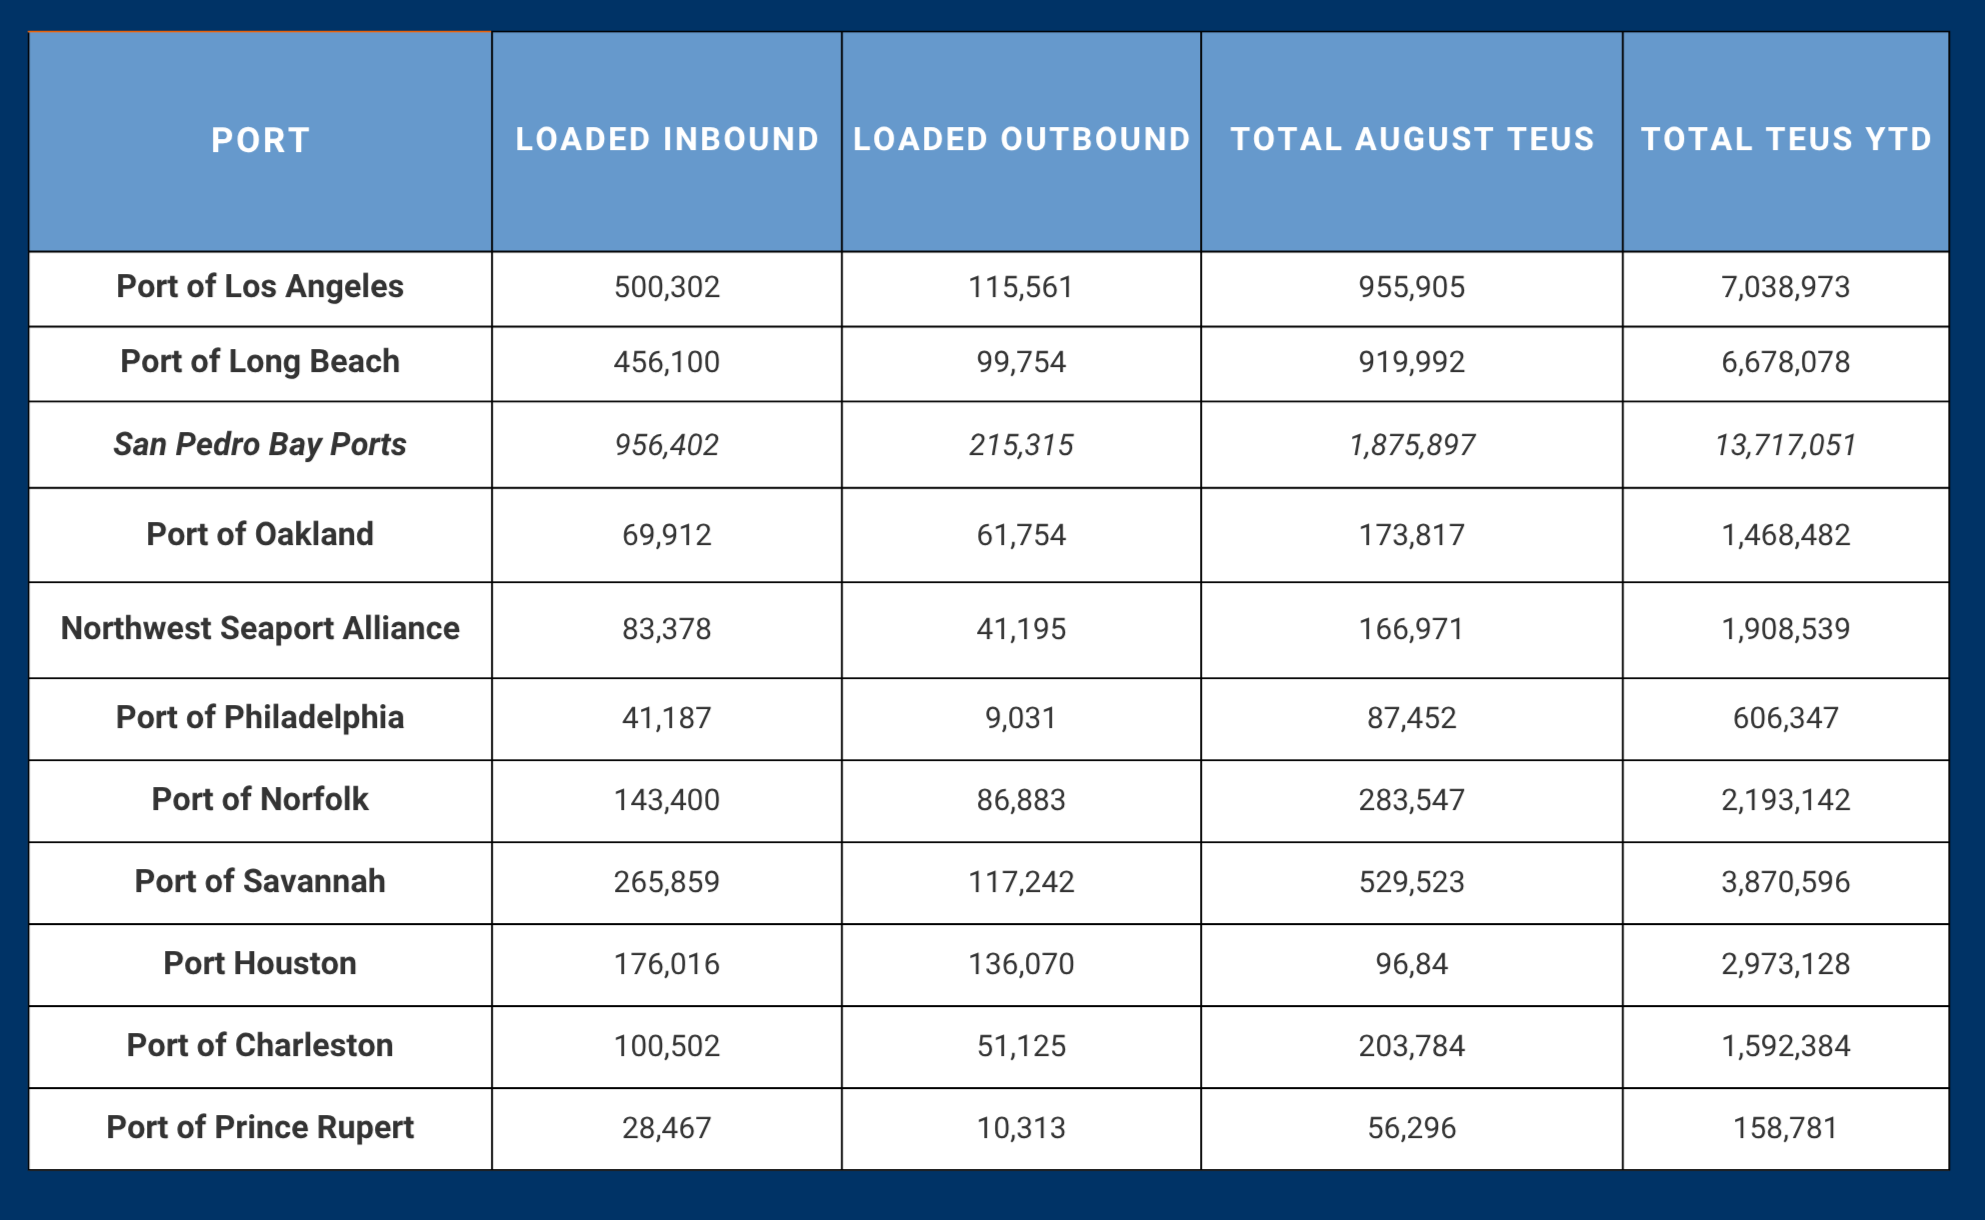
The ports at the nation’s premier container trade gateway, the San Pedro Bay, posted some historic numbers. At the Port of Los Angeles, total container traffic YTD through the Southern California port amounted to 7,038,973 loaded and empty TEUs, up 11.5% over the same period in pre-pandemic 2019. August concluded the busiest three-month period in the port’s history. For August specifically, vessels discharged 500,302 laden TEUs, down 0.8% from a year earlier but up 14.3% over August 2019. Outbound loads in August fell 9.3% to 115,561 TEUs from the previous August and by 21.0% from August 2019.
The neighboring Port of Long Beach celebrated its busiest August in its 115-year history. The year’s eighth month saw the San Pedro Bay port handle 456,100 inbound loaded TEUs in August, a 3.6% year-over-year gain and a 41.3% improvement over August 2019. The 99,754 outbound loads shipped from the port in August represented a 4.0% increase from a year earlier but a 20.2% decline from August 2019. Total container traffic through the port thus far this year amounted to 6,678,078 TEUS, a 41.9% gain over the 4,397,788 TEUs processed in the same eight months in 2019.
The Port of Oakland posted meager numbers in August as the Northern California gateway continued its downward year. This year's eighth month saw the port discharge just 69,912 laden TEUs, down 15.0% from a year earlier and 20.8% below August 2019's volume. Although the port's outbound traffic in August was off by only 1.2% from a year earlier, the 61,754 laden TEUs shipped in August were down 17.7% from August 2019. Total container traffic YTD amounted to 1,468,482 TEUs, down 13.5% from the volume handled over the same period seven years ago.
The Northwest Seaport Alliance Ports of Tacoma and Seattle also had a disappointing August, with import loads of 83,378 TEUs down 10.3% from a year earlier as well as down by 25.7% from August 2019. Year-to-date, import loads were off by 13.2% from last August and down by 25.6% from the same months in 2019. Laden export container traffic in August, while off by only 2.1% year-over-year, was down 45.0% from August 2019. So far this year, export loads are down 36.1% from the first eight months of 2019. YTD, total box trade through the two Puget Sound ports amounted to 1,908,539 TEUs, down 25.5% from the same period in 2019.
556701Further north along North America’s Pacific coast, the Port of Prince Rupert fared poorly in August, with 28,467 inbound loaded TEUs down 35.1% from a year earlier and 60.2% below the volume handled in August 2019. The 10,131 outbound loads shipped from the port in August were off by 7.8% from the previous August and down by 33.1% from August 2019. Total YTD container traffic through the port in British Columbia amounted to 556,701 TEUs, down 28.9% from the same period in 2019.
PhilaPort (the Port of Philadelphia) handled 41,187 inbound laden TEUs in August, a 15.1% year-over-year gain as well as a 61.9% increase over August 2019. Meanwhile, 9,031 outbound laden TEUs were shipped from the port, up 15.4% from the preceding August and up 49.2% from August 2019. Total YTD container traffic through the Delaware River facility amounted to 606,347 TEUs, a 48.5% increase over the same period in 2019.
In the Mid-Atlantic Coast range, the Port of Norfolk discharged 143,400 inbound loaded TEUs in August, a 2.4% increase from a year earlier as well as an 18.0% gain over August 2019. Outbound loads in August (86,883 TEUs) were up 1.8% year-over-year and 7.7% above the number shipped in August 2019. Total loads and empties processed through the Virginia gateway so far this year amounted to 2,193,142 TEUs, up 10.9% from the same months in 2019.
The Port of Savannah processed 265,859 inbound loaded TEUs in August, a 1.5% bump over the previous August and a 22.5% gain over August 2019. The 117,242 outbound laden TEUs that sailed from the Georgia port in August represented a 4.2% year-over-year increase but a 6.4% decline from August 2019. Total container traffic through the first eight months of this year amounted to 3,870,596 TEUs, a 25.8% gain over the same period in pre-pandemic 2019.
August saw the arrival at South Carolina’s Port of Charleston of 100,502 laden inbound TEUs, down 9.2% from a year earlier and 2.6% below the volume recorded seven year earlier in August 2019. Outbound loads (51,125 TEUs) slipped by 2.7% year-over-year and by 30.8% from August 2019. Total box traffic YTD through the southern Atlantic Coast port amounted to 1,592,384 empty and laden TEUs, down 3.6% from the same period in pre-pandemic 2019.
Over on the Gulf Coast, Port Houston discharged 176,016 inbound loads in August, up 3.8% from a year earlier and up 59.6% from August 2019. Outbound loads in August (136,070 TEUs), while off by 1.6% from the previous August, were up by 24.4% from August 2019. Total container traffic YTD through the Texas maritime gateway amounted to 2,973,128 TEUs, up 50.1% over the first eight months of 2019.
What a difference a smattering of turmoil makes
Back in June, when the Port of Los Angeles announced its $3.4 billion budget for the next fiscal year, port officials downgraded their outlook for container volumes over the next twelve months. According to an in-house analysis, the nation’s largest container gateway expected to handle 9.3 million loaded and empty TEUs in the fiscal year that started on July 1. That volume would represent a seven percent year-over-year decline.
That outlook was broadly consistent with the contemporaneous forecast issued on June 8 by the National Retail Federation Global Port Tracker. That forecast expected 2.25 million TEU to arrive in June at the 13 U.S. seaports it monitors. While that would represent a 14.3% increase over relatively low level of imports a year earlier, the following three months were all expected to record year-over-year declines. July was forecast at 2.19 million TEUs, down 8.4% from a year earlier, while August was expected to see an 8.6% year-over-year fall-off. September’s volume was projected to be down 2.2%, before October was expected to see a very modest 0.1% bump upward from August 2025.
But the boxes kept arriving, completely upsetting the forecasters. According to a report in Supply Chain Dive, the Port of Los Angeles is now planning for a 5% year-over-year uptick in cargo volumes in the next six to eight months, as conflict in the Red Sea persists and draft restrictions from the Panama Canal have helped drive containers the port’s way. Due to the ongoing concerns at the Suez Canal and the Panama Canal, "more cargo is going to be flowing through the West Coast ports and primarily here to southern California," LA Port Executive Director Gene Seroka said. He added that "seeing different routes, like ones through the West Coast, can not only cut down on transit time, but also the cost associated with shipping those goods."
The Port of Los Angeles’ Port Optimizer continues to see September container traffic running well ahead of last year’s volumes.