
Where did the Japan Trade Go?
There was a time when Japan seemed primed to overtake the United States as the World’s Largest Economy. That was in the early 1990s, when Japan accounted for one-fifth of America’s merchandised import trade. From Berkeley to Harvard, academics churned out books touting the superiority of Japan’s approach to business which emphasized the cooperative relations between the nation’s major banks and corporations under the guidance of the Ministry of International Trade and Industry.
In 1990, Japan accounted for 18.1% of U.S. merchandise imports. Last year, Japan’s share of that trade was 4.3%. As AI Overview tells us: “Japan’s legendary 1980s economic boom faltered due to the catastrophic asset price bubble in the early 1990s. This triggered decades of slow growth and deflation.”
At its peak, one of the more noisome claims of Japanese boosters was that the value of the land under the Imperial Palace in Tokyo was higher than all of the real estate in California. By 2025, Governor Gavin Newsom’s office issued a press release stating that data from the International Monetary Fund and the U.S. Bureau of Economic Analysis showed that California’s gross domestic product exceeded Japan’s, making the Golden State the world’s fourth largest economy after the United States, China, and Germany.
Over the past ten years, a dramatic shift occurred in the sourcing of products imported into the United States. Japan’s containerized exports to the U.S. increased by just 3.4%, while Vietnam’s containerized shipment to the United States soared by 333.1%, from 4,055,357 metric tons in 2015 to 17,565,449 metric tons last year.
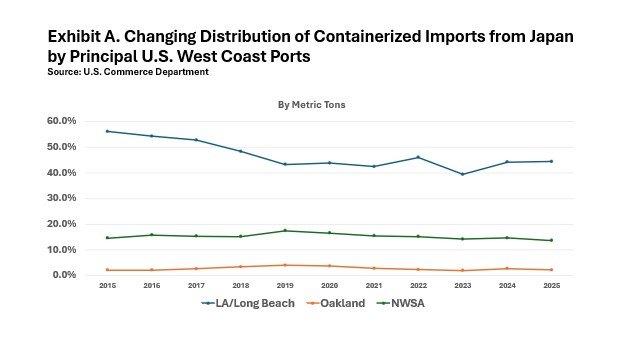
As Exhibit A reveals, there have also been shifts in the ports through which Japanese containerized exports have entered the U.S. market.
As Exhibit A further shows, the major USWC ports’ collective share of containerized imports from Japan fell largely because shippers have lately been steering shipments away from the Ports of Los Angeles and Long Beach. As recently as 2015, those two ports in Southern California controlled 56.1% of the Japanese import trade. The following year witnessed the opening of the new set of more commodious locks at the Panama Canal, and the San Pedro Bay ports’ share of Japanese containerized shipments to the U.S. soon began to plunge. By last year, that share fell to 44.4%. By comparison, the other two principal USWC maritime gateways, Oakland and the Northwest Seaport Alliance Ports to Tacoma and Seattle saw little change. Oakland’s 2.1% share in 2015 barely moved to 2.2% last year, while the two NWSA ports’ 14.6% share in 2015 was not substantially above its13.7% share in 2025.
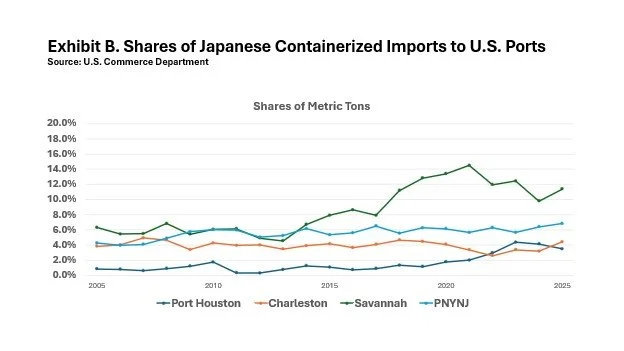
Exhibit B reveals that the Port of Savannah enjoyed the biggest bump in its share of Japan’s containerized imports to the U.S. The Georgia port’s 7.9% share in 2015 boomed during the COVID years to as high as 14.5% in 2021 before settling to 11.4% last year. The Port of Charleston did not fare as well, as its share only nudged up from 4.2% in 2025 to4.4% in 2025. The Port of New York/New Jersey held a 5.4% share in 2015 and a 6.8% share last year. Most surprisingly, perhaps, is that the diversion of Japanese shipments to U.S. ports did not result in Port Houston overtaking any of its East of Panama rivals once the new set of locks opened. Still, the Texas gateway did see its share of Japanese containerized imports grow from 1.1% in 2015 to 3.5% last year.