
Vietnam has quickly become one of America’s foremost trading partners, albeit primarily on the import side. Last year, it ranked fifth as a source of U.S. imports behind Mexico, Canada, China, and Taiwan, but ahead of Germany, Japan, and South Korea. However, as a destination for U.S. exports, it ranked just 27th, lodged between Chile and Poland.More immediately, during the first three quarters of this year, Vietnam has been the second leading source of goods imported through the U.S. customs districts encompassing the three West Coast states. With $74.030 billion in imports so far this year, Vietnam was edged out for first place by Taiwan’s $74.332 billion.
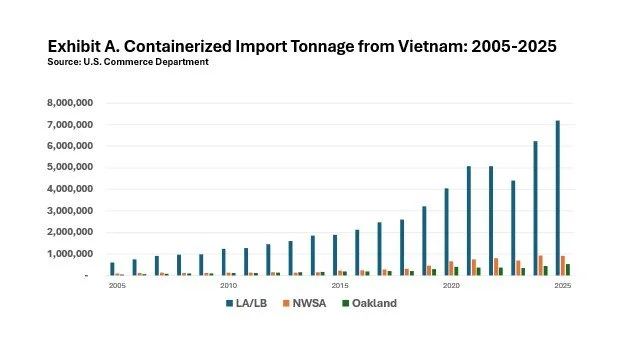
Two decades ago, in 2005, a total of 1,147,129 metric tons of containerized shipments from Vietnam arrived at all U.S. mainland ports. By last year, that trade had swollen to 17,458,578 metric tons, as Exhibit A shows. Through this year’s first three quarters, containerized import tonnage from Vietnam was up 5.5% from the same months a year earlier.
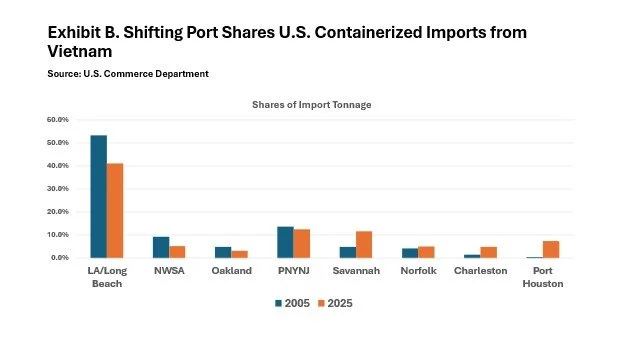
As displayed in Exhibit B, 53.4% of all containerized imports from the Southeast Asian nation arrived at the Ports of Los Angeles and Long Beach in 2005. By last year, though, those ports’ share had declined to 41.2%, even though the volume of imports had swollen nearly twelve-fold to 7,189,129 metric tons from 613,093 metric tons.
The shares of the inbound container trade from Vietnam similarly fell at the Northwest Seaport Alliance Ports of Tacoma and Seattle from 9.3% in 2005 to 5.2% in 2025, while the Port of Oakland’s share slipped from 4.8% to 3.1%. As with the two Southern California ports, declining shares did not mean declines in business. Both ports saw huge boosts in the volume of imports from Vietnam over the past two decades, from 55,614 metric tons in 2005 to 541,238 metric tons at Oakland last year and from 106,292 metric tons to 909,392 metric tons at the NWSA ports over the same period.
Still, several major ports elsewhere in the country experienced substantial gains in their shares of containerized imports from Vietnam. The most dramatic increase was recorded by Port Houston, which saw its share soar from 0.4% in 2005 to 7.4% last year. Savannah (4.8% to 11.7%) and Charleston (1.5% to 4.9%) also recorded impressive gains. Noticeably absent from the gainers, though, was the Port of New York /New Jersey, which sustained a fall-off in its share of the Vietnam import trade from 13.7% in 2005 to 12.5% last year.
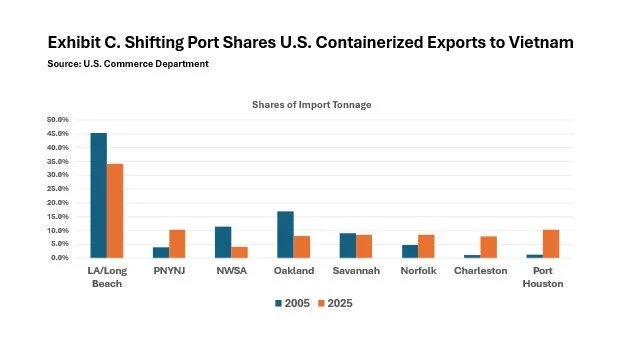
America’s $178.276 billion merchandise trade deficit with Vietnam last year was reflected in the imbalance of containerized tonnage moving through U.S. seaports. Total containerized import tonnage from Vietnam in 2025 amounted to 17,458,578 metric tons, while total containerized export tonnage shipped to Vietnam that same year amounted to 8,484,907 metric tons of generally much less valuable commodities than what we imported from Vietnam. Still, last year’s containerized export trade was significantly more than the 425,938 metric tons of containerized goods the U.S. shipped to Vietnam in 2005.
As Exhibit C reveals, all of the major USWC maritime gateways handled smaller shares of all U.S. containerized exports to Vietnam, as did Savannah. The most remarkable gains were recorded at Port Houston (1.2% in 2005 to 10.3% last year) and Charleston (1.1% to 7.9% over the same period). But the Port of New York/New Jersey also grew its share of the trade from 3.9% in 2005 to 10.2% last year.