
Black Swans and Container Forecasts
By Jock O’Connell
In antiquity, seers may have literally coughed up prophecies after closely examining the entrails of recently sacrificed animals for clues as to the most opportune time to plant a new crop, arrange a royal marriage, or lay siege to Troy. Alas, the manuals used to train these oracles and the qualifications they were required to possess have been largely lost. But at least we can say it took guts to venture a forecast on which your life might depend.
Today’s diviners of the future fortunately eschew the use of internal organs and instead rely on reams of statistical data and intricate methodologies to sort through factors such as GDP growth, personal income, employment rates, currency values, household consumption patterns, etc. Or perhaps they simply ask AI for a hand sorting through all the numbers. Further, given our limited attention spans these days, even the reputations of the hired gurus are seldom smirched by predictions that have gone disastrously awry not because of incompetence but because a Black Swan, an unexpected but consequential development, suddenly flew into the picture.
Pity, for example, the highly regarded consulting team that delivered a carefully wrought container forecast for the San Pedro Bay Ports of Los Angeles and Long Beach just at the moment in 2007 when the Great Recession abruptly disrupted global economies and sent international trade careening off the rails. (Since even the Masters of the Universe on Wall Street did not see that one coming, the Ports graciously granted the consultants a mulligan.)
In their revised outlook delivered in 2009, the consultants wrote that their initial forecast was based on the best trade and economic data available at the time, but: “Actual performance was much worse than forecast as U.S. and world-wide economic downturns eroded containerized trade. Volumes were flat in 2007 and down in 2008; container counts dropped another 22% in the first quarter of 2009 compared to 2008. The U.S. experienced its worst recession since World War II. Findings were based on the most current thinking in the container industry.”
This past February, the Ports of Los Angeles and Long Beach collectively commissioned a new cargo forecast to assess the prospects of growth in container traffic through 2050. The last comprehensive forecast for container growth through the two ports was conducted in 2017 by forecasters who, of course, could not have anticipated the next Black Swan, the worldwide COVID-19 pandemic that would severely test the global trading system beginning in early 2020. Nor, perhaps, could they have fully anticipated how unsettling Donald Trump’s predilection for tariffs might be in January 2019.
By the time the Western world first became aware of the Chinese city of Wuhan in early 2020, the Ports of Los Angeles, Long Beach, Oakland, Seattle, and Tacoma all had received forecasts to determine the likely rates of future growth in container traffic, especially the all-important traffic in inbound loaded TEUs. So, as we await the new San Pedro Bay container forecast, I thought it might be helpful to look back on how well (or poorly) the pre-plague forecasts for the three principal maritime gateways on the U.S. West Coast have held up.
The San Pedro Bay Ports 2017 Forecast

Exhibit A reveals how that 2017 outlook matched up with what actually happened over the next seven years in terms of total container traffic including both laden and empty TEUs.
Exhibit B focuses on inbound loaded containers, while Exhibit C looks at outbound loaded container traffic.

Perhaps the most interesting take-away from Exhibit A is that the forecast started to go seriously awry in 2019, a year before the plague erupted globally. Wuhan, the Chinese city where the virus first appeared, recorded its first official cases in December 2019. It was not until January 30, 2020, that the World Health Organization declared COVID-19 a “Public Health Emergency of International Concern”. That was the same day on which Italy had its first confirmed cases. By March 19, Italy overtook China as the country with the most reported cases. (That was the same day the Governor of Majorca ordered me and all other non-residents to leave the island as expeditiously as possible.)
The Northwest Seaport Alliance 2017 Forecast
The Washington Public Ports Association and the state’s Freight Mobility Strategic Investment Board jointly commissioned the 2017 Marine Cargo Forecast and Rail Capacity Analysis. Like virtually all maritime trade forecasts, it looked for sustained growth in container volumes moving through the NWSA ports. Total international trade was expected to achieve compound annual growth rates (CAGR) ranging from a low of 1.3% to as much as 3.7% from 2015 through 2035. A CAGR of 2.2% was held out as the most likely outcome.
In retrospect, it Is difficult to account for such a buoyant outlook. As the analysis noted, container volume had edged up at an annual rate of only 0.9% between 2000 and 2015. The forecast then provided a number of candid admissions about the challenges facing the NWSA ports: “International container traffic peaked in 2007 then fell sharply during the Great Recession. Volumes have since recovered some of the lost ground, but competing ports in British Columbia have gained market share at our expense. International container volumes are projected to grow, but the rate of growth will depend on the ability of local ports to compete with other regions. Growth in domestic containers (i.e. Alaska and Hawaii) is likely to be slow.”
It went on to note that: “Competition is especially fierce from ports in Southern California and British Columbia, as well as ports on the East and Gulf Coast. Southern California is especially attractive to shippers due to its large population base, and British Columbia has been able to offer a low-cost alternative to ports in the Pacific Northwest.”
Still, the forecast hoped that TEU import traffic might increase by as much as 4.3% per year, although it was more confident about a 2.1% CAGR. At the very least, volumes would inch up at 1.2% pace.
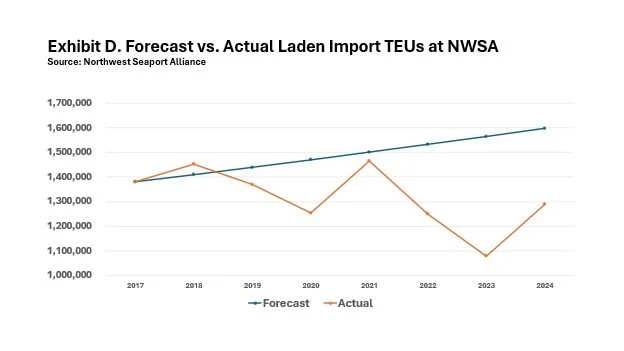
Let’s let the NWSA’s own numbers in Exhibits D and Exhibit E tell the story.
I should note that, through the first seven months of 2025, the laden TEU import numbers have been running 0.9% ahead of last year’s tally at this point, while export loads have declined by 1.0%.
Port of Oakland Container Forecast

Few ports have been promised rosier but ultimately unrealized container volumes than the Port of Oakland, the San Francisco Bay Area gateway that handles 99% of all containerized goods moving through Northern California ports.
Back in 1982, when the Port was still in the process of consolidating the Bay Area’s containerized commerce and container traffic was chiefly measured in short tons, not TEUs, the Port received a forecast that expected the Bay Area’s container traffic to “increase to four times its present volume by the year 2000”. It was a forecast that established a pattern by which the port’s container forecasts consistently overestimated actual container traffic, a shortcoming the port’s officials have had occasion to publicly lament. The most likely scenario in that 1982 forecast anticipated that container volumes would soar to 19,610,000 short tons by 2000 before leaping to 49,020,000 short tons in 2020. In the real world, containerized tonnage through the Port peaked in 2020 at 16,830,631 short tons. Last year, the port handled 14,279,228 short tons of containerized cargo.
The Port’s next forecast arrived in 1988 and expected TEU traffic to grow to 5,087,000 TEUs by 2020. According to the Port’s records, it actually handled just 2,461,889 TEUs in 2020. Last year, some 2,262,921 TEUs passed through the San Francisco Bay Port.
Yet another forecast was presented to Port officials in July 2009. This outlook expected the Port to be handling 2,723,000 TEUs in 2015 and 3,427,000 in 2020 before ultimately reaching 5,067,000 TEUs in 2030. It billed its expectations as “modest”.

The latest forecast for the Port of Oakland was published in late May 2020, after COVID hit but before its real impact would become evident. That foresaw a jump in loaded import and export TEU traffic from 1,754,499 TEUs in 2018 to as high as 5,000,365 TEUs in 2050. Even the forecast’s moderate growth scenario assumed that a CAGR of 2.4% would yield a volume of 3,729,745 TEUs by mid-century.
As Exhibit F shows, the Port’s actual container-handling in recent years suggests a less robust trajectory going forward, even if current trade disputes are quickly resolved.
The commentary, views, and opinions expressed by Jock O’Connell are his own and do not reflect the views or positions of the Pacific Merchant Shipping Association. PMSA does not endorse, support, or make any representations regarding the content provided by any third party commentator.