
The Real Value of Imports
The maritime industry’s preferred metric is the TEU. Moving steel boxes of generally uniform dimensions and weight from foreign suppliers to end-users is what the transportation industry does. This past summer saw an exceptionally high level of TEUs arrive at the Port of Los Angeles and Long Beach. Less robust was the number of inbound TEUs at the Ports of Oakland and the Ports of Tacoma and Seattle.
But what about the declared value of the contents of all those inbound TEUs? What might the value numbers tell us about the imports entering the U.S. through the major U.S. West Coast maritime gateways that is not evident in the TEU tallies?
The Foreign Trade Division of the U.S. Census Bureau is the official compiler of America’s international trade statistics. Each month, the statisticians at the Foreign Trade Division produce many interesting breakdowns of trade numbers, among them tables that contrast the nominal value of U.S. imports and exports with their real values that have been adjusted to reflect inflation, currency changes, and seasonality. Afterall, we all appreciate that it generally costs us more for a given product than what we paid for the same produce last year or back before COVID disrupted global economics.
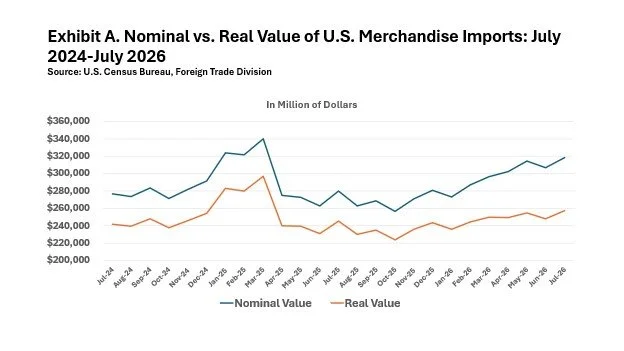
Exhibit A distinguishes the nominal from the real value of U.S. merchandise imports over the two-year period from July 2024 through this past July. This period clearly encompasses the adjustments American importers made to ramp up imports ahead of Donald Trump’s return to the White House and his announcement of broad new in April 2025.
Exhibit A further indicates that, while nominal and real values initially mirrored each other through 2024 and 2025 before diverging around the start of this year. Exhibit B provides an explanation for that divergence, a substantial rise in imports of Capital Goods and the decline in the value of Consumer Goods imports.
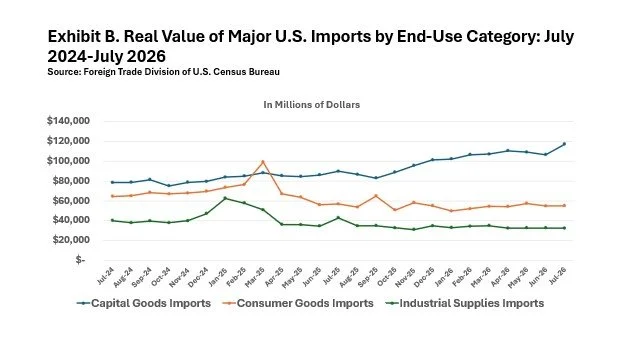
Exhibit B shows the real values for the top three U.S. imports by end-use categories as defined by the U.S. Foreign Trade Division. Here we see that importers of Industrial Supplies were the first to react to the prospect that candidate Trump would be true to his campaign rhetoric. Importers of Consumer Goods responded with the sharpest spike as the April 2, 2025 “Liberation Day” approached, when President Trump announced a broad array of new, higher tariffs. What stands out, though, is that imports of Capital Goods have risen almost continuously. In July 2025, Consumer Goods accounted for 26.7% of U.S. merchandise imports, while imports of Capital Goods held a 32.4% share. By this July, Capital Goods accounted for 45.6% of the value of U.S. merchandise imports, while the value of Consumer Goods imports fell to a 21.4% share.
To be sure, the government’s definition of Capital Goods encompasses a number of products that should be more accurately seen as Consumer Goods. Items like desktop PCs, laptops, tablets, and smart phones would be among the more obvious candidates for reclassification.
So how do all these gadgets get here from abroad?
In 2025, $49.344 billion or 72.9% of the $55.369 billion in laptops and tablets arrived in the U.S. aboard air freighters or in the cargo holds of passenger aircraft. Oceanborne shipments amounted to $9.171 billion.
Smartphone imports last year were valued at $65.385 billion, of which $62.209 billion were airborne, with just $718,000 worth entered U.S. seaports. 72.0% of smartphone imports by air were recorded at Chicago airports. Los Angeles International Airport was the recorded port of entry of 13.2% of the air trade in smartphones.