
U.S. Port Import Values Drop Faster Than Tonnage After Liberation Day Tariffs
To paraphrase an adage, when you’ve seen one port statistic, you’ve seen one port statistic. As much as seaport officials like to roll out their latest TEU tallies, there are alternate measures of the nation’s waterborne trade that provide alternative indices of the economic importance of port operations. Foremost among these are the figures provided on the tens of thousands of import/export documents filed every day with U.S. Customs and Border Protection. These data points serve as the empirical grist for the foreign trade statistics compiled and published monthly by the Foreign Trade Division of the U.S. Census Bureau, an agency of the U.S. Commerce Department. The cargo weight numbers are of immense importance to transportation industry providers and planners, while the cargo value numbers establish -- much more usefully than any tally of boxes -- the true economic worth of the nation’s foreign commerce.
So here we present the Top 20 Port rankings for the First Quarter of 2026 for both containerized imports and exports by both tonnage and value. By convention, we have collapsed the data for the Ports of Los Angeles and Long Beach as well as the numbers for the Ports of Tacoma and Seattle.
Exhibit A. Top 20 U.S. Ports
First Quarter Containerized Import Trade
By Declared Tonnage in MTs
| Port/Gateway | Q1 2025 | Q1 2026 | |
|---|---|---|---|
| 1 | LA/Long Beach | 14,396,167 | 13,049,415 |
| 2 | PNYNJ | 9,159,900 | 8,772,011 |
| 3 | Savannah | 4,846,376 | 4,821,791 |
| 4 | Houston | 4,449,597 | 4,324,356 |
| 5 | Norfolk | 2,783,069 | 2,997,090 |
| 6 | Charleston | 2,569,356 | 2,500,954 |
| 7 | NWSA | 2,276,524 | 1,821.084 |
| 8 | Oakland | 1,700,466 | 1,525,342 |
| 9 | Baltimore | 1,512,765 | 1,397,764 |
| 10 | Philadelphia | 1,548,282 | 1,368,584 |
| 11 | Miami | 1,204,466 | 1,200,431 |
| 12 | New Orleans | 541,300 | 813,390 |
| 13 | Port Everglades | 960,690 | 805,339 |
| 14 | JaxPort | 644,896 | 584,196 |
| 15 | Mobile | 499,535 | 494,352 |
| 16 | Wilmington, DE | 446,733 | 426,127 |
| 17 | Boston | 262,967 | 460,598 |
| 18 | San Juan | 722,255 | 395,972 |
| 19 | Port Hueneme | 386,930 | 382,318 |
| 20 | Chester, PA | 305,965 | 318,223 |
By Declared $ Value In Billions
| Port/Gateway | Q1 2025 | Q1 2026 | |
|---|---|---|---|
| 2 | PNYNJ | $42.566 | $38.286 |
| 3 | Savannah | $22.607 | $21.166 |
| 4 | Norfolk | $14.659 | $15.591 |
| 5 | Houston | $16.556 | $15.497 |
| 6 | Charleston | $14.247 | $13.278 |
| 7 | NWSA | $12.715 | $10.280 |
| 8 | Oakland | $7.769 | $6.486 |
| 9 | Baltimore | $6.517 | $6.198 |
| 10 | Philadelphia | $6.005 | $5.462 |
| 11 | Miami | $4.544 | $4.305 |
| 12 | Chester, PA | $3.879 | $3.254 |
| 13 | Mobile | $2.183 | $2.726 |
| 14 | New Orleans | $2.043 | $2.588 |
| 15 | Port Everglades | $2.971 | $2.230 |
| 16 | JaxPort | $2.353 | $2.005 |
| 17 | Wilmington, NC | $1.645 | $1.271 |
| 18 | San Juan | $1.552 | $1.161 |
| 19 | Boston | $1.124 | $0.991 |
| 20 | Port Hueneme | $0.834 | $0.835 |
Exhibit B. Top 20 U.S. Ports
First Quarter Containerized Export Trade
By Declared $ Value In Billions
By Declared Tonnage in MTs
| Port/Gateway | Q1 2025 | Q1 2026 | |
|---|---|---|---|
| 1 | LA/Long Beach | 5,008,042 | 5,140,058 |
| 2 | Port Houston | 4,610,211 | 4,600,365 |
| 3 | Savannah | 3,676,824 | 3,733,657 |
| 4 | PNYNJ | 2,682,615 | 2,714,828 |
| 5 | Norfolk | 2,419,533 | 2,570,598 |
| 6 | Charleston | 1,708,648 | 1,717,602 |
| 7 | NWSA | 1,673,465 | 1,694,635 |
| 8 | Oakland | 1,607,040 | 1,636,980 |
| 9 | New Orleans | 916,899 | 803,189 |
| 10 | Port Everglades | 535,048 | 523,042 |
| 11 | Baltimore | 443,870 | 464,143 |
| 12 | Miami | 461,035 | 458,068 |
| 13 | Mobile | 421,870 | 341,262 |
| 14 | Wilmington, NC | 243,060 | 224,492 |
| 15 | West Palm Beach | 175,128 | 182,093 |
| 16 | JaxPort | 179,895 | 162,506 |
| 17 | Boston | 137,358 | 161,506 |
| 18 | San Juan | 125,841 | 144,956 |
| 19 | Gulfport, MS | 167,188 | 141,406 |
| 20 | Philadelphia | 169,191 | 139,711 |
| Port/Gateway | Q1 2025 | Q1 2026 | |
|---|---|---|---|
| 1 | LA/Long Beach | $12.352 | $11.758 |
| 2 | Port Houston | $9.403 | $9.500 |
| 3 | PNYNJ | $9.314 | $9.446 |
| 4 | Norfolk | $8.094 | $8.215 |
| 5 | Savannah | $6.633 | $6.412 |
| 6 | Oakland | $4.390 | $4.515 |
| 7 | Charleston | $3.704 | $3.320 |
| 8 | Port Everglades | $3.097 | $2.927 |
| 9 | NWSA | $2.385 | $2.462 |
| 10 | Miami | $2.327 | $2.358 |
| 11 | Wilmington, NC | $1.207 | $1.356 |
| 12 | New Orleans | $1.472 | $1.307 |
| 13 | Baltimore | $0.961 | $1.259 |
| 14 | Chester, PA | $1.337 | $1.236 |
| 15 | Philadelphia | $1.096 | $0.954 |
| 16 | San Juan | $1.187 | $0.861 |
| 17 | JaxPort | $0.855 | $0.821 |
| 18 | W. Palm Beach | $0.649 | $0.631 |
| 19 | Mobile | $0.629 | $0.504 |
| 20 | Portland, ME | $0.199 | $0.244 |
As this graph reveals, the two variables have tended to track each other closely, even through the period of the Great Recession and the onset of the COVID-19 epidemic. For most of the past two decades, however, year-over-year changes in value assessments have grown faster than increases in declared cargo weight, except quite recently.
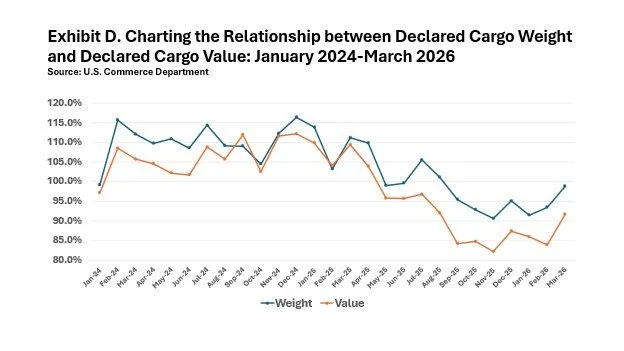
Exhibit D focuses on the months before and after the April 2, 2025 “Liberation Day” tariff increases.
U.S. importers moved to limit their exposure to the new tariffs. Some of these measures they adopted have involved persuading overseas suppliers to cut their export prices. Another popular tactic has been to rejigger supply chains so as to source imported goods from nations facing relatively low tariff rates. Yet another tactic has been to house imported merchandise in foreign trade zones where the payment of duties can be postponed. Whatever means are being used to reduce the declared value of containerized imports, the result has been fairly clear. Exhibit D testifies to the assiduousness of those efforts, especially in the year since Liberation Day. Import values at U.S. ports lately have been dropping faster than import tonnage.
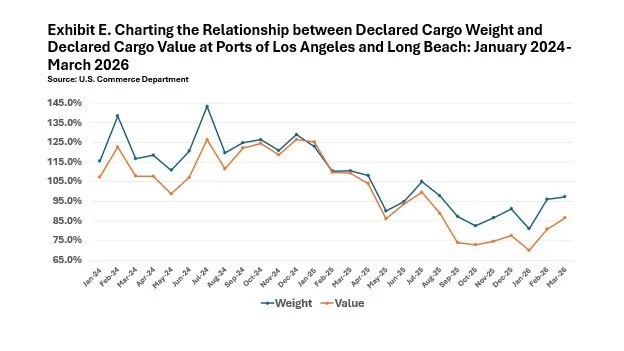
Exhibit E focuses on changes in the declared weight and dollar value of containerized goods imported through the Ports of Los Angeles and Long Beach. Here, the experience of the two big Southern California ports nearly recapitulates what we have seen happening nationally over the past year.