

Search our collection of articles, blogs, resources and more to stay informed on the goods movement sector.


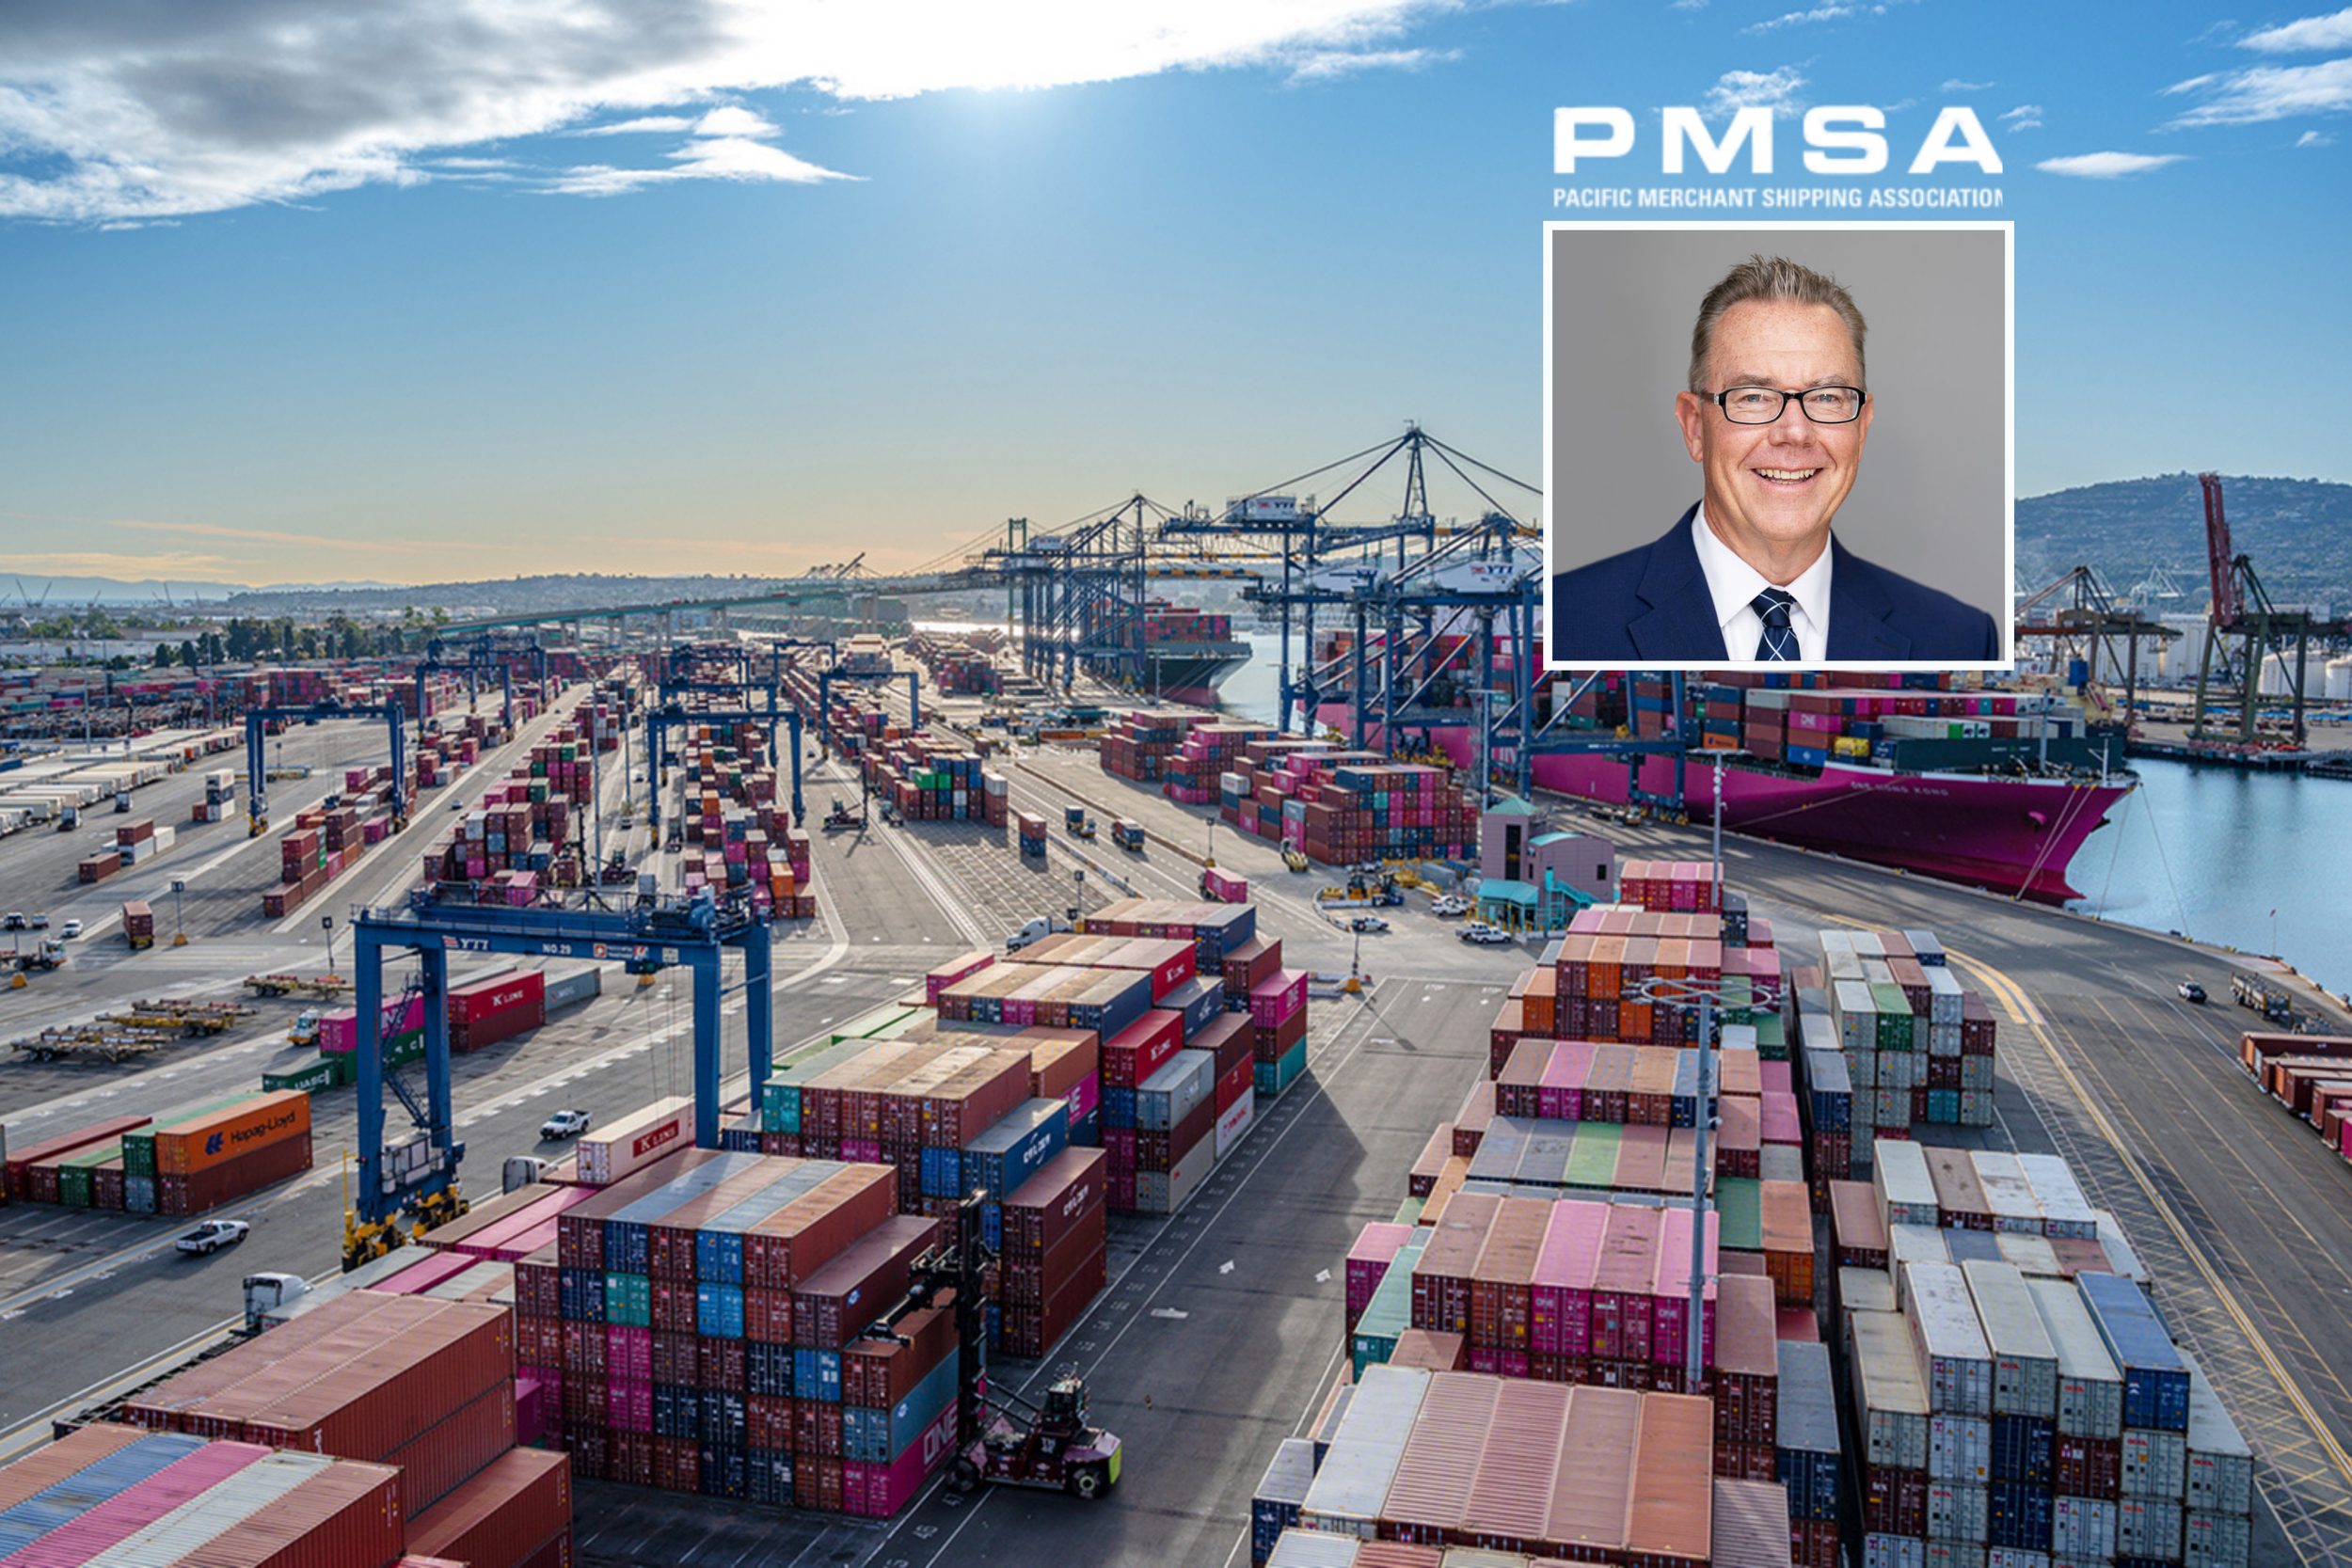
Southern California Ports Have Regained Their Growth Footing, But West Coast Gateways Still Have a Heavy Lift to Full Recovery
By Mike Jacob, President, Pacific Merchant Shipping Association
Southern California ports are posting record volumes, but Gulf and East Coast gateways are still winning the market share battle. Here's why.

March 2026 Container Traffic at North American Ports
March 2026 container data is in. West Coast ports face year-over-year dips while Houston and Virginia post gains.

The Latest News on the Proposed Port Project at Coos Bay
What happened at the Coos Bay container terminal forum, and what didn't get answered. PMSA's update on Oregon's proposed new port project.

Fertilizer Imports from the Strait of Hormuz War Zone
With the Strait of Hormuz closed, U.S. fertilizer imports are under pressure. PMSA examines how West Coast ports and American farmers are exposed to the disruption.
Container Statistics for February 2026
February 2026 container volumes are in. See how LA, Long Beach, Houston, and 20+ North American ports performed against last year and 2019 benchmarks.

Changing Origins of U.S. Automobile Tires
China's share of U.S. tire imports dropped from 25% to 3.5% in a decade. PMSA tracks where those imports are coming from now — and which ports are winning the trade.
Beyond the Mega-Ports: Who Plays in Which League?
Not every port should be measured against LA or New York. PMSA breaks down which North American container ports are actually competing in the same league.

USWC Shares of Container Traffic through U.S. Ports in February 2026
How much of U.S. container trade flows through West Coast ports? PMSA's February 2026 data tracks USWC market share by tonnage and value, for both imports and exports.