
Search our collection of articles, blogs, resources and more to stay informed on the goods movement sector.
A Cautionary California Tale for the Pacific Northwest
By Jordan Royer, Vice President External Affairs, Pacific Merchant Shipping Association


The Future of Maritime: The Amazing Women in Maritime 2026
By Natasha Villa, External Affairs Manager, Pacific Merchant Shipping Association
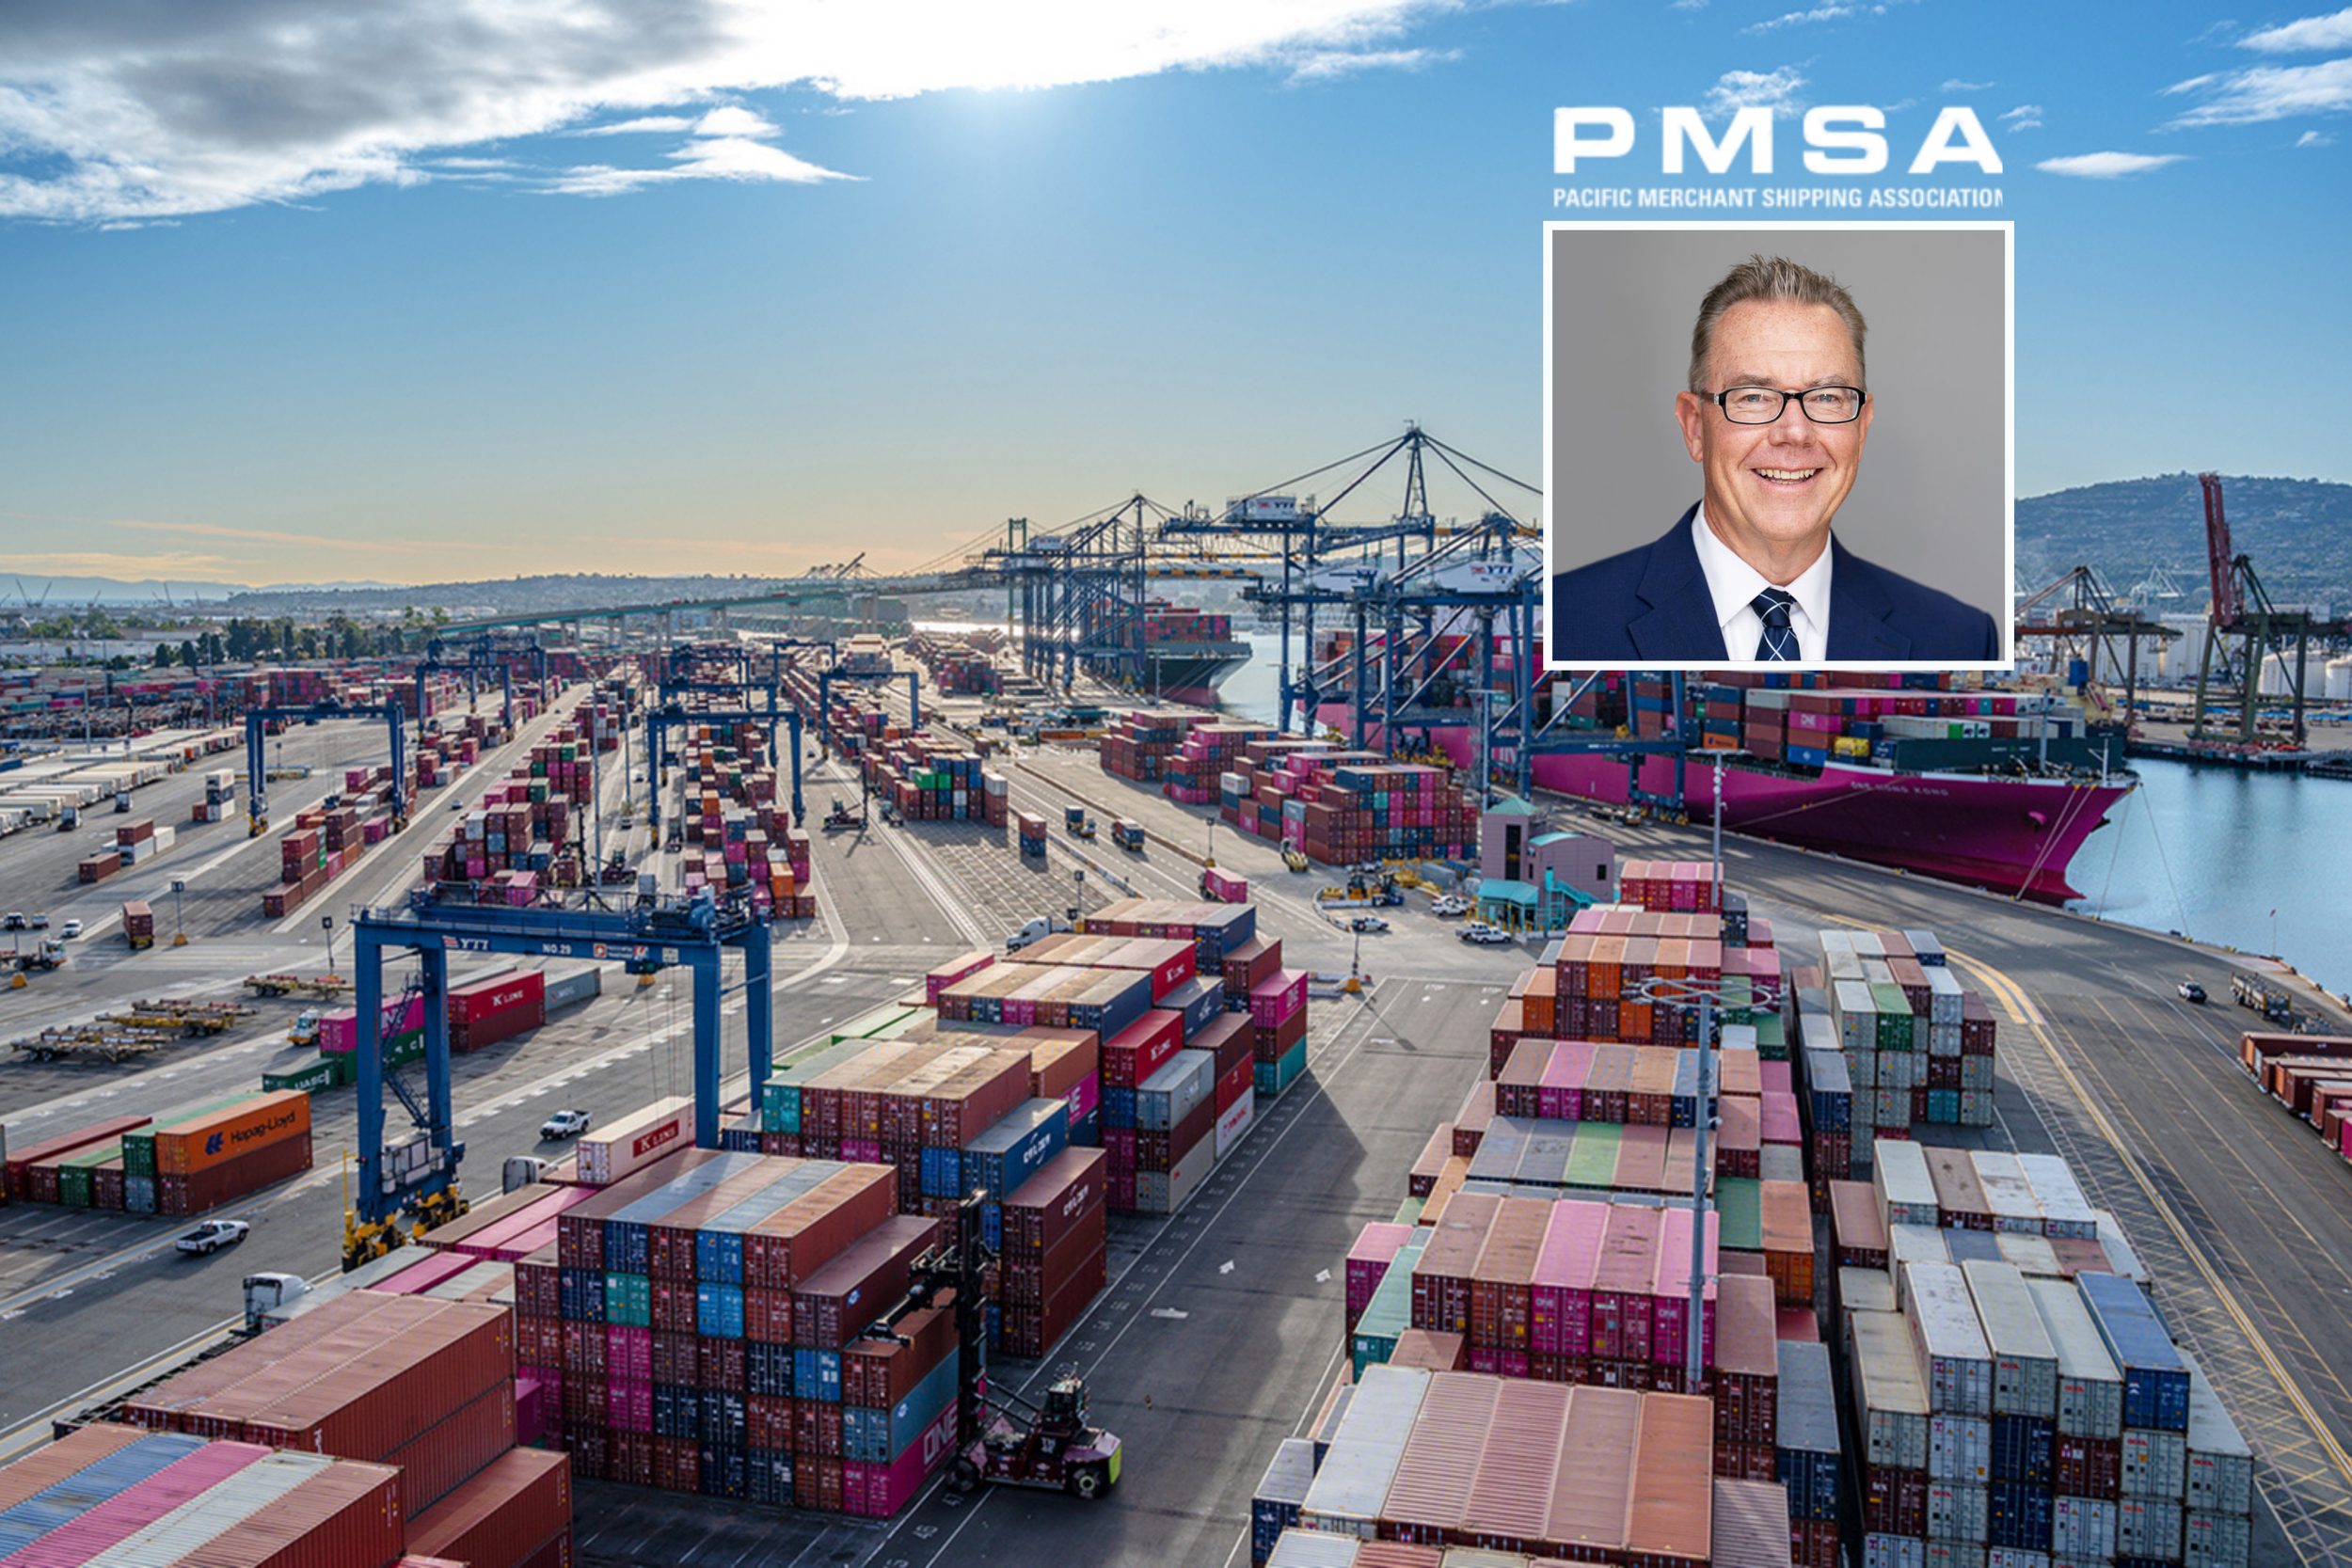
Southern California Ports Have Regained Their Growth Footing, But West Coast Gateways Still Have a Heavy Lift to Full Recovery
By Mike Jacob, President, Pacific Merchant Shipping Association
Southern California ports are posting record volumes, but Gulf and East Coast gateways are still winning the market share battle. Here's why.
March 2026 Container Traffic at North American Ports
March 2026 container data is in. West Coast ports face year-over-year dips while Houston and Virginia post gains.
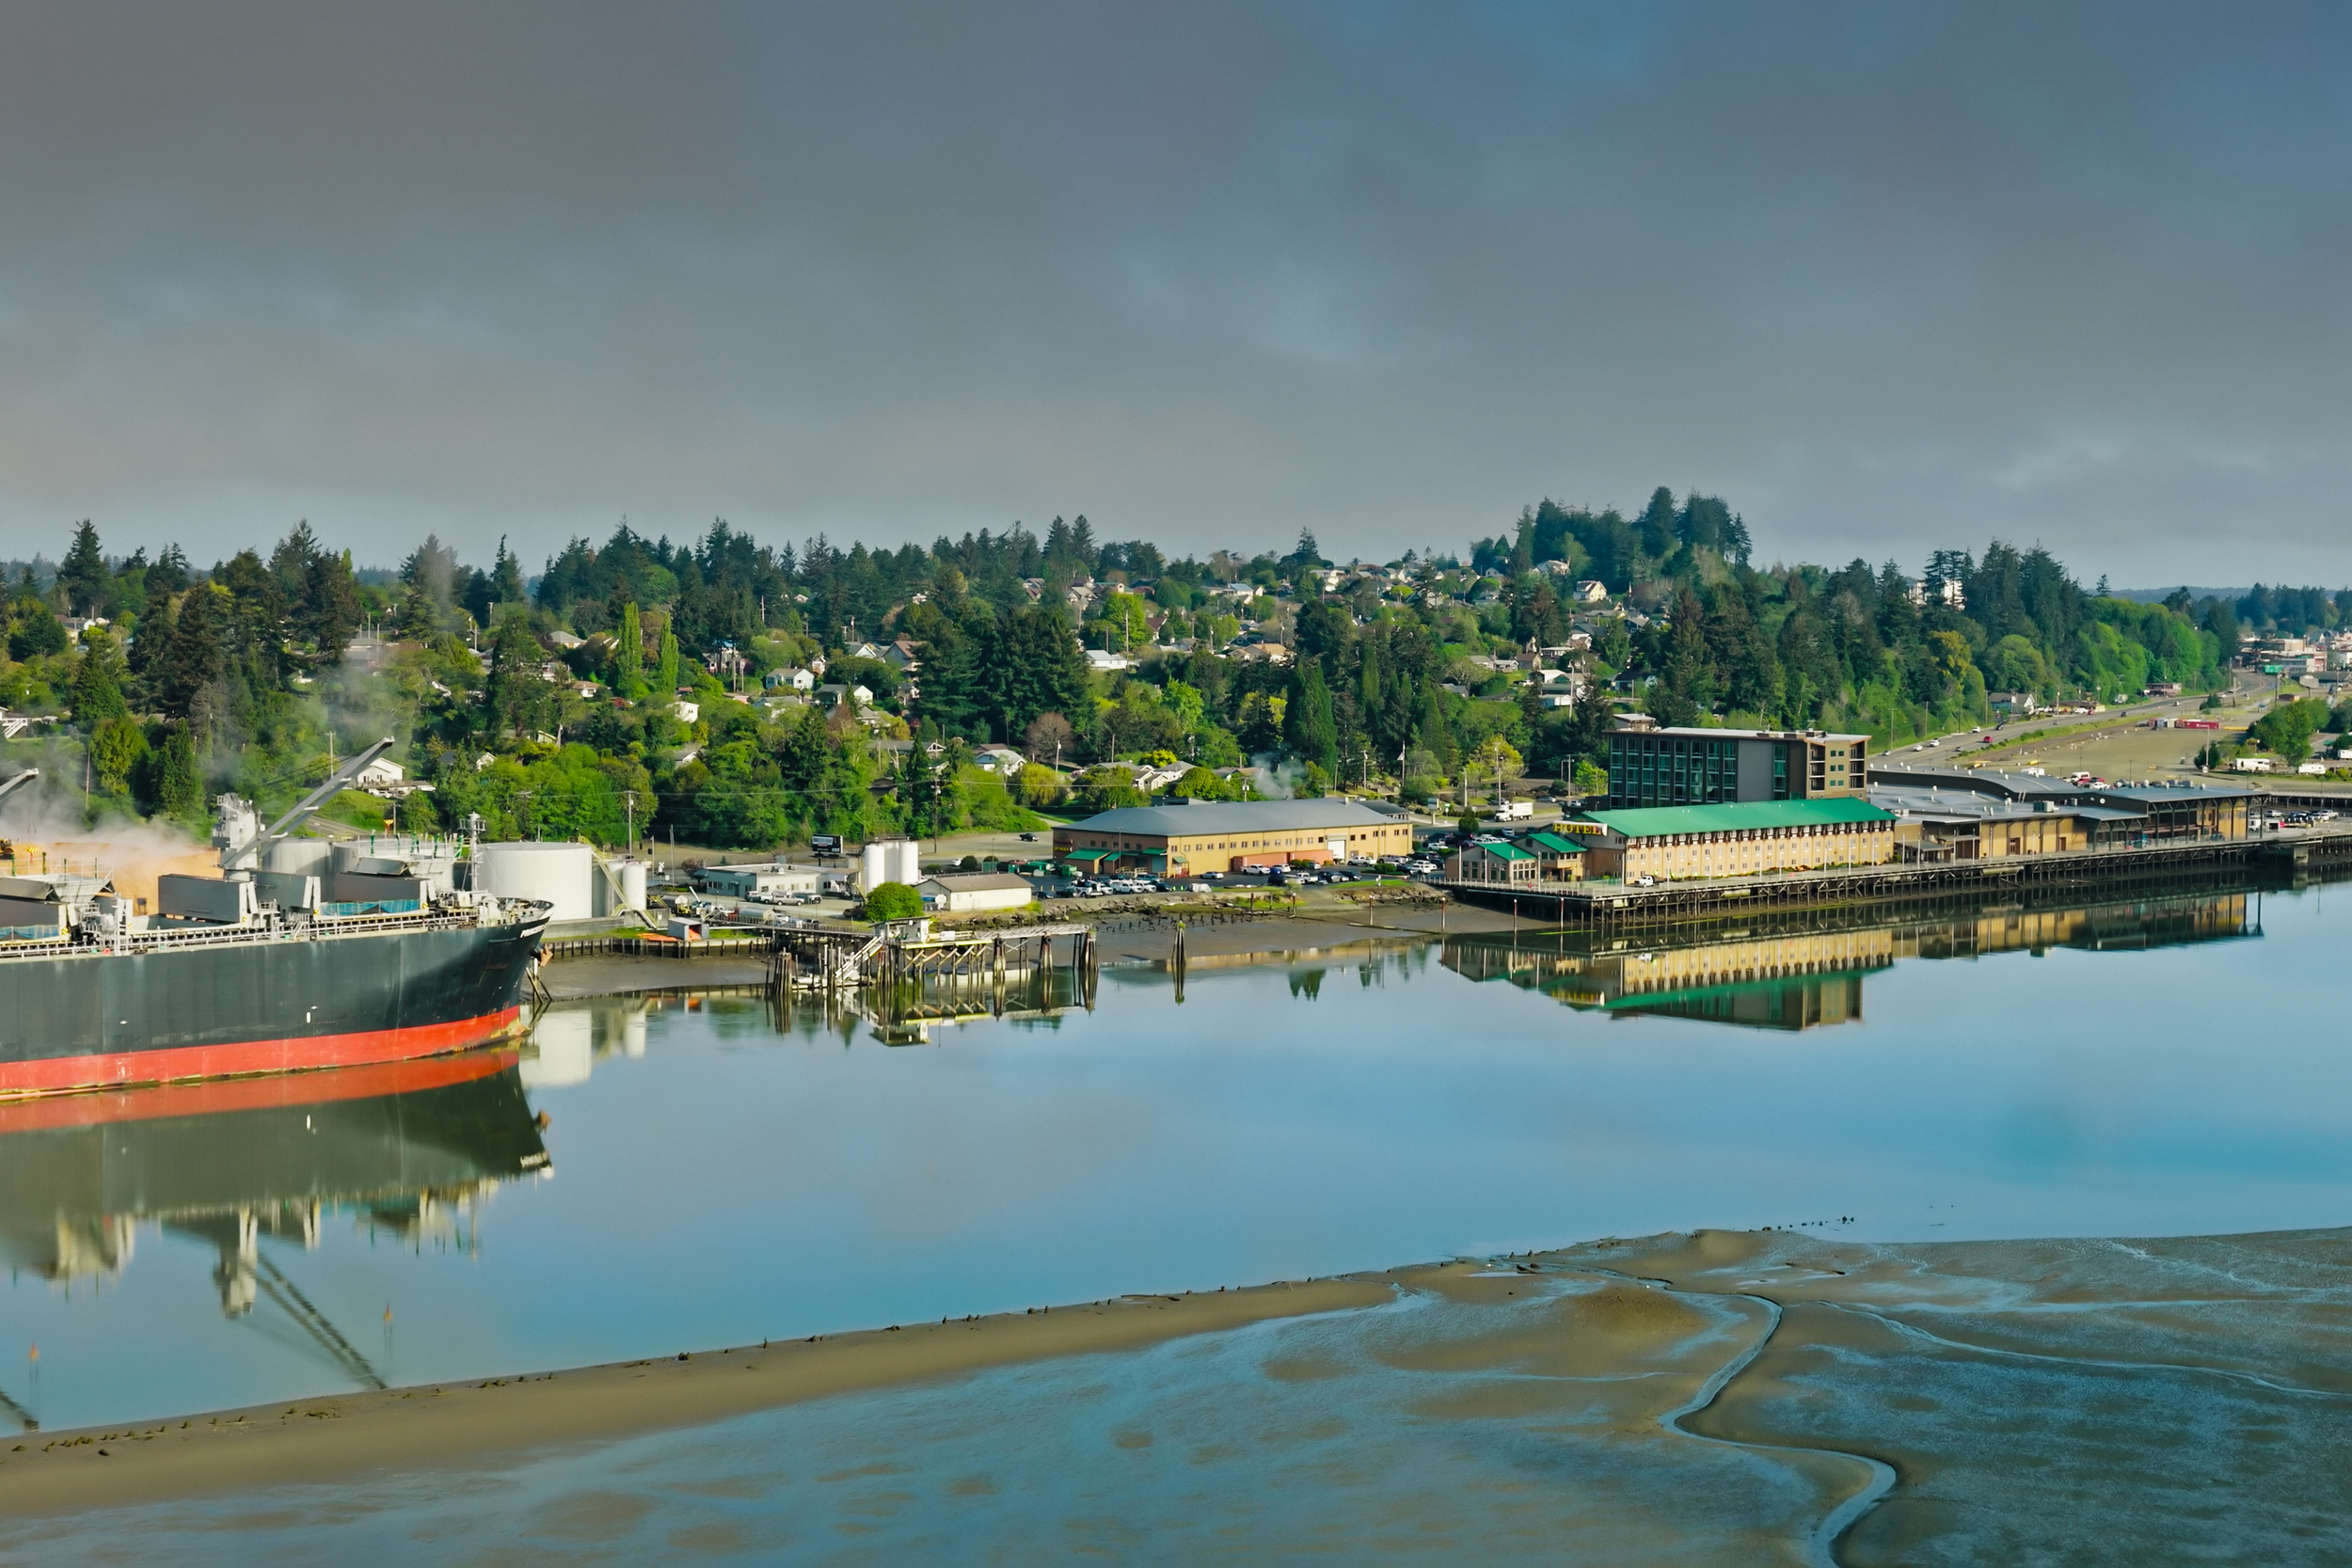
The Latest News on the Proposed Port Project at Coos Bay
What happened at the Coos Bay container terminal forum, and what didn't get answered. PMSA's update on Oregon's proposed new port project.

Fertilizer Imports from the Strait of Hormuz War Zone
With the Strait of Hormuz closed, U.S. fertilizer imports are under pressure. PMSA examines how West Coast ports and American farmers are exposed to the disruption.