
A Decade of Septembers at Six Major Pacific Coast Ports
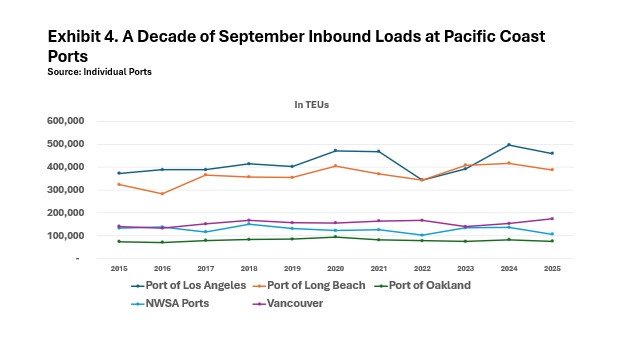
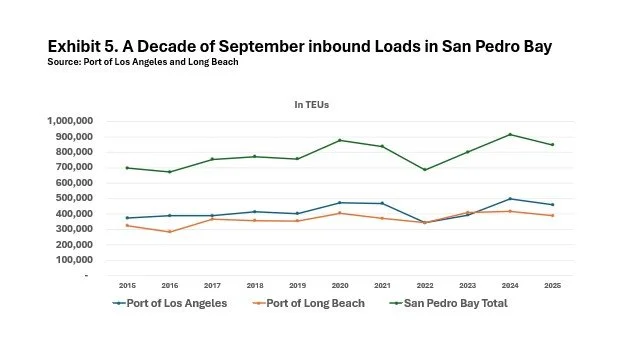
Although a month of data do not a trend make, a decade of numbers for a single month, in this case September, is somewhat more illuminating. The accompanying Exhibit 4 displays the volume of loaded inbound traffic in each September over the past decade for the six largest ports on the Pacific Coast of the United States and Canada. Because the volume of traffic is so much higher at the Ports of Los Angeles and Long Beach, we have appended two separate graphs with Exhibit 5 showing the number of inbound loaded TEUs handled by those Southern California ports and Exhibit 6 displaying the number of September inbound loads reported by the Ports of Oakland, the Northwest Seaport Alliance Ports of Seattle and Tacoma, and the Port of Vancouver in British Columbia.
Perhaps the most salient conclusion to be drawn from these September numbers is just how much the Port of Los Angeles and Long Beach have been consolidating their dominance of the USWC container trade. Back in September 2015, the two San Pedro Bay ports accounted for 77.2% of inbound loaded TEUs at the five major USWC ports. This September, that share stood at 82.4%. Over the same period, Oakland’s share declined to 7.4% from 8.1%, while the NWSA ports’ share fell even more precipitously to 10.3% from 14.7%.
As for the crossborder competition between NWSA and Vancouver, the Canadian port’s share of inbound loads swelled to 62.1% this September from 53.1% last September as new U.S. tariff policies came into effect.
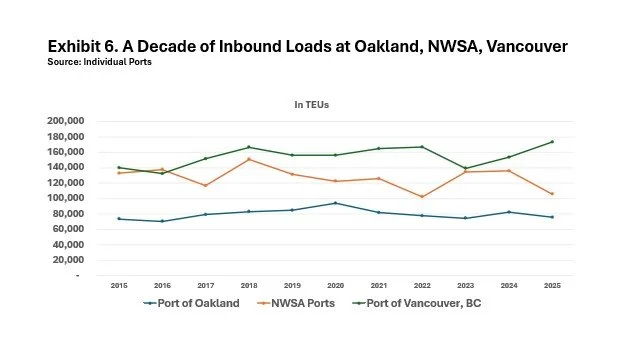
In September 2025, Oakland discharged 75,716 inbound loads, only 2,296 more than the port had handled ten years earlier in 2015 and just 1,726 more inbound loaded TEUs than it had processed ten years before that in September 2005. In short, traffic inbound loads at Oakland in September have barely increased in twenty years. Oakland’s peak September for inbound loads actually peaked at 93,914 TEUs. Apart from that exceptional first year of the COVID pandemic, the Northern California gateway’s highwater mark for inbound loads in the month of September was set six years ago in pre-pandemic 2019 at 84,906 TEUs.
Container trade statistics published by the NWSA are unique in distinguishing international traffic through the Ports of Tacoma and Seattle from the ports’ domestic container trades with Alaska and Hawaii. Looking solely at the NWSA ports’ international import trade, September import loads peaked at 150,902 TEUs in pre-pandemic 2018.
As Exhibit 6 attests, the Port of Vancouver has not endured the wrenching gyrations in trade that have occurred on the U.S. side of the border. Indeed, in its direct competition with the NWSA ports, Vancouver has been on a growth trajectory since 2023.