
Are 2025’s Shocks to the Intermodal System Cementing the Pandemic-Era Divergence in Fortunes At US West Coast Ports?
By Mike Jacob, President, Pacific Merchant Shipping Association
It has been hard to tease out discernable long-term trends from the many twists-and-turns of the numerous compelling storylines prompted by the countless unprecedented disruptions to the intermodal market in 2025. The unprecedented use of the word “unprecedented” and certainly overused reference to “uncertainty” have been two mainstays for all of us who watch and comment on intermodal trends this year.
But one story on container volumes gathering steam since the pandemic has unfortunately not been clouded over this year: the dramatic divergence among West Coast ports that reveals fundamental shifts in North American trade patterns and port competitiveness seems to be cementing and not abating. In short: the gap is widening, not stabilizing.
Through the topsy-turvy first eleven months of 2025, the Ports of Los Angeles and Long Beach nonetheless saw a compelling year of growth with combined year-to-date volumes of 16,895,405 million TEUs - as of October 2025. But Oakland and the Seattle and Tacoma complex have been experiencing a very different reality in 2025. The performance gaps that started to develop in 2019 have not only persisted, but the divergence trend is accelerating and the patterns are mimicking those that we experienced during the Great Recession.
The performance gap between Southern California, Oakland, and the Pacific Northwest exposes not only a loss of long-term market share for the entire US West Coast, but it also raises macro-economic alarm bells about the strength of the US Export Market in the containerized trades (see Jock O’Connell’s commentary on the Crisis of America’s Containerized Export Trade).
Can anyone give a cogent prediction as to what the broader trade winds for 2026 will develop for our US West Coast gateways at this point? This question will be so wrapped up in geopolitical-economics that there is no clear prognostication; but, that is precisely what makes the emergence of these clear trends for Oakland and the Pacific Northwest so discouraging. In a world with few constants, little precedent, and overwhelming uncertainty, it can be very hard to discern trends in general, yet these specific market trends are certain, constant, historically consistent, and clearly (if not sharply) defined.
The West Coast intermodal divergence story line has become well-defined over the last two decades. The Southern California Ports of Los Angeles and Long Beach, the Port of Oakland, and the Northwest Seaport Alliance Ports of Seattle and Tacoma all enjoyed periods of robust growth through 2005-2006, where they hit pre-recession peaks. All three port complexes saw their markets and volumes move in relative parallel both during the Great Recession and during the Recession recovery period (2008-2012). From 2012 to 2019, these parallels continued, with all three port complexes moving in the growth direction through 2019. Albeit the main difference being that Southern California and Oakland moved into positive territory on growth relative to 2006 while NWSA was still in negative territory, but the relative parallels and trend lines were similar. But 2019-2020 marked a clear divergence point. While pre-pandemic 2019 was the peak for Oakland and NWSA, Los Angeles and Long Beach have had a completely different performance trajectory after 2020.
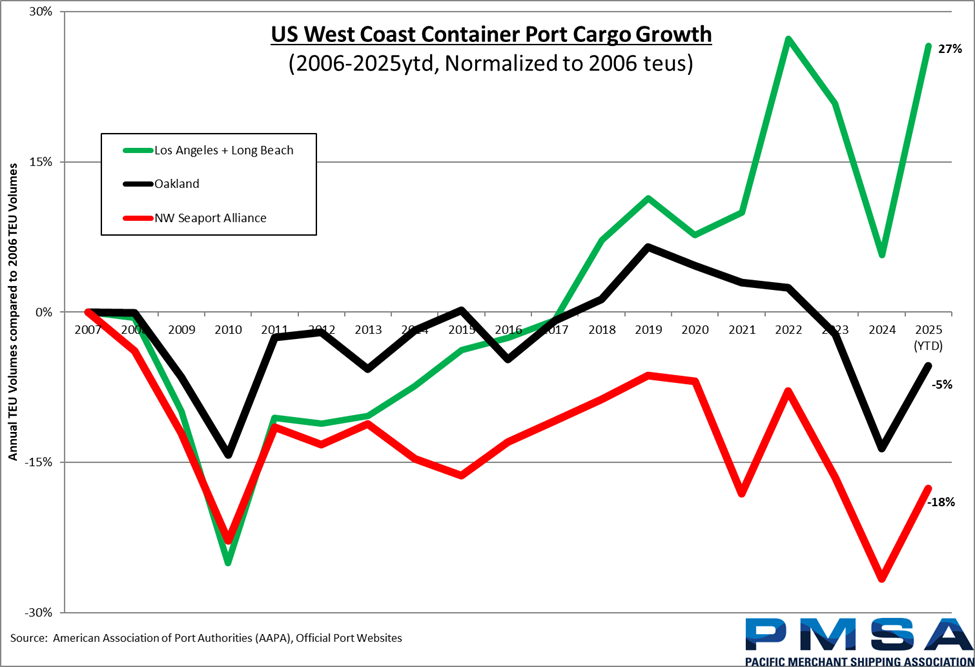
As this US West Coast Container Port Cargo Growth chart demonstrates, all three port complexes saw a 2019-2020 slowdown in volumes, but after that, the numbers tell a different story.
In 2021, the pandemic demand tsunami whip-sawed the Ports of LA and Long Beach, with a cargo volume turn-around that continued unabated through the highs of record-breaking volumes in 2022. The Southern California ports held on to those gains in 2023, gave some back in 2024, but 2025 is projected to be the third-best year on record for the complex.
Oakland and the Puget Sound ports never saw that rebound, and current performance trends are actually mirroring those that we haven’t experienced since the Great Recession.
2025’s year-to-date data seems to only cement the persistence of these fundamentally different trajectories that have been building for years, both through the pandemic and through the recent tariff upheavals.
Through the first ten months of 2025, the Port of Los Angeles processed 8.67 million TEUs, representing a 10.2% increase over the same period in pre-pandemic 2019. The neighboring Port of Long Beach handled 8.23 million TEUs, an even more impressive 29.3% gain over 2019. Combined, the San Pedro Bay port complex has moved 16.90 million TEUs year-to-date, an impressive 18.74% increase over 2019.
In contrast, the Port of Oakland's 1.90 million TEUs through October represents a 9.9% decline from 2019 levels, and the Northwest Seaport Alliance has processed 2.67 million TEUs, down 17.2% from the same period in 2019.
These 2025 year-to-date volumes, normalized against pre-Great Recession peak 2006 levels, confirm the divergence:
West Coast Port Growth Relative to 2006 Baseline
These relative volumes confirm that during the Great Recession and early recovery, all three port complexes moved largely in parallel. The downturn hit all ports similarly, with volumes dropping roughly 25% from 2006 levels by 2008-2009. The subsequent recovery through 2012 also showed parallel movement, though at different rates, with volumes still well below 2006 baselines.
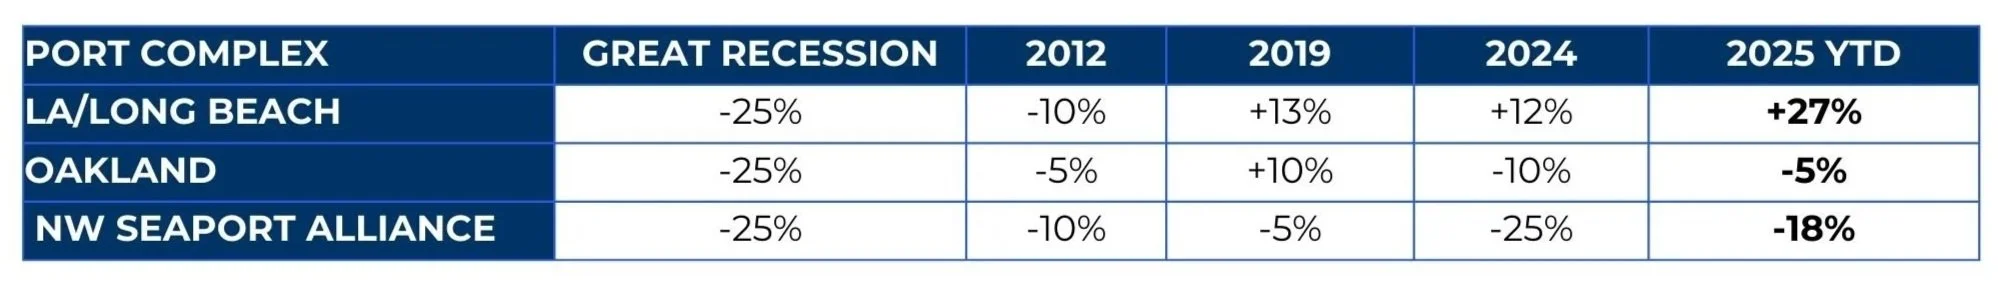
From 2012 through 2019, the California ports began to separate with Washington falling behind, although all three were moving in a positive direction compared to the Great Recession lows. By the time we hit pre-pandemic highs, the Ports of Los Angeles and Long Beach climbed to 13% above their 2006 baseline by 2019 and Oakland reached 10% above 2006. The Northwest Seaport Alliance, however, remained 5% below its 2006 volumes even at the 2019 peak. The current spread between the best and worst performing West Coast port complexes stands at 45 percentage points, with Los Angeles/Long Beach at +27% above 2006 levels while NWSA sits at -18% below 2006.
Of course, it deserves to be mentioned that the US West Coast divergence story exists within a broader national context: loss of marketshare and ongoing intermodal competitiveness. Along the US East and Gulf Coasts and in Canada, major gateways are still successfully competing with all US West Coast ports for intermodal discretionary volumes.
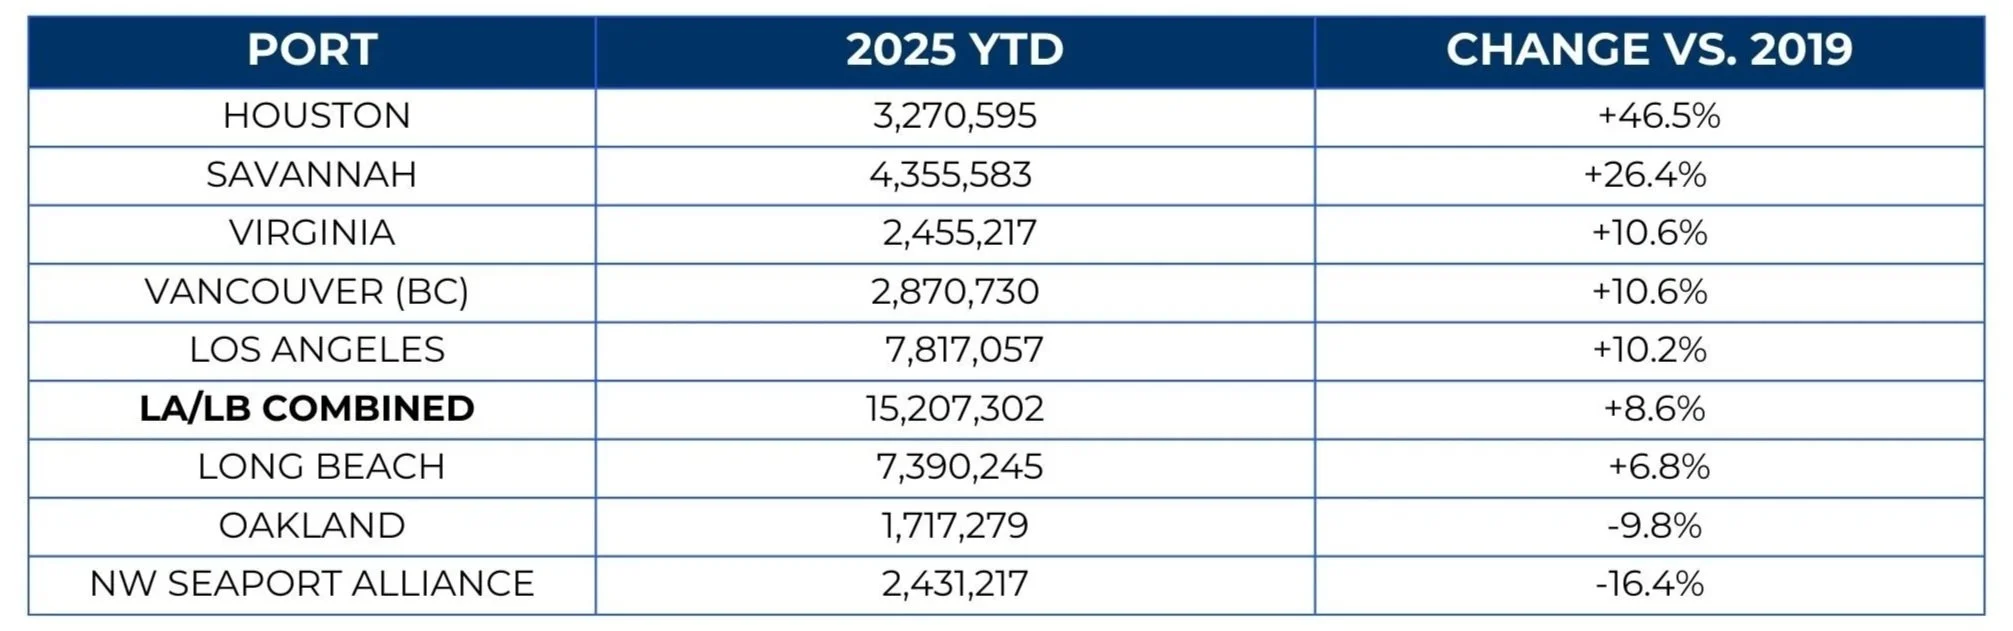
For example, Houston, Savannah, Vancouver BC, and Virginia, all showed strong 2025 year-to-date performances through September that were stronger than any of US West Coast ports. When these numbers are weaved into the US West Coast divergence story, the Oakland and NWSA challenges gain even sharper focus:
Year-to-Date Container Volumes Through September 2025 (in TEUs)
We are definitely exceptionally pleased that the Ports of Los Angeles and Long Beach are seeing high performance, recapturing marketshare from competitors, and hitting these strides with virtually no terminal congestion (see PMSA’s November Dwell Time Statistics for LA/LB), and now stand 27% above their 2006 baseline volumes, accelerating away from pre-pandemic performance.
What we experienced in both the pre-Great Recession and post-Great Recession recovery periods was that US West Coast growth does not necessarily need to be mutually exclusive or intra-gateway competitive. We know this because volume growth patterns were occurring across all gateways simultaneously and in parallel.
But, what we have yet to analyze or understand is why that parallel success has now been disrupted. While LA and Long Beach have hit three peaks, Oakland has returned to essentially flat performance versus 2006, while the Northwest Seaport Alliance sits 18% below its 2006 volumes, with performance levels reminiscent of the Great Recession era.
The 45-percentage-point spread between the highest and lowest performing West Coast port complexes represents not just a snapshot of 2025 performance, but the culmination of a 5-year divergence in West Coast port competitiveness.
It will also be imperative on the maritime industry in 2026 to also ensure that these divergence trends are not made worse through anti-competitive local and state regulatory actions. While Southern California is actually moving in the right direction for further growth, with the avoidance of the proposed Indirect Source Rule for the ports and the inking of a deal to focus on new infrastructure investment in its intermodal system, by contrast the State of Washington is actually creating new regulatory liabilities and considering higher operational costs for Seattle and Tacoma. Regulators in Olympia will need to decide in 2026 if they want to continue to impose punitive stormwater permit requirements on Ports and marine terminals and if they want to approve a recent petition from the Puget Sound Pilots for a 50% increase on all pilotage rates. Wrong decisions in these cases will only continue to put the NWSA behind the competitiveness 8-ball.
It is past time to have a serious discussion of the root causes and the broader market implications for Northern California and Washington. We need to work together to find ways to reduce costs, increase demand, deploy incentives to boost competitiveness, and increase the volumes and recapture intermodal marketshare for all three US West Coast gateways, NWSA, Oakland, and Southern California, vis-à-vis US Atlantic, Gulf, and Canadian ports.