
Peak Globalization and the Crisis of America’s Containerized Export Trade
By Jock O’Connell, Economist
At least since 2008, when Wall Street banks coughed up that mighty furball of unsecured mortgage loans that sent shudders throughout the world’s financial system and severely upset the established rhythms of international commerce, economic analysts have been alert to signs that the once seemingly relentless progression toward globalization is being rolled back.
Back in 2000, a prominent economist named Jeffrey Frankel (MIT, Harvard) devised an index to gauge the extent to which national economies were coalescing around extended supply chains. Frankel’s Index (as it has come to be known) has been very influential in academic circles. Its most widely cited variation focuses on measuring the import share of a country’s GDP to calculate the degree to which it has become integrated with the global economy. Much less attention has been given to doing the globalization calculations from the perspective of exporting.
A quarter century ago when President Bill Clinton left office, economic integration on a global scale was moving expeditiously forward, driven by policies that encouraged trade liberalization. During Clinton’s presidency (1993-2001), U.S. policymakers actively pursued an internationalist agenda by, most conspicuously, negotiating the North American Free Trade Agreement, pushing through the Uruguay Round of Multinational Trade Negotiations (which established the World Trade Organization), and then shepherding China’s accession to the WTO in 2001. Notably during the same period, the European Union, which then included the United Kingdom, launched a single market with a common currency.
However, the financial crisis of 2008 prompted a broad reassessment of the virtues of tightly integrated international markets.
By the time of Barack Obama’s presidency (2009-2017), it was becoming glaringly apparent that, at least for America, globalization meant a soaring reliance on imports that was hugely unbalanced by growth in exports. What was good for U.S. consumers did not necessarily make for a sustainable economic strategy for U.S. farmers and manufacturers. And, eventually, the nation increasingly found itself in competition for diplomatic as well as military influence with China, our chief supplier and creditor.
It was the so-called Twin Deficits that candidate Donald Trump exploited in the run-up to the 2017 presidential election and again in his 2024 campaign to regain the White House. In both cases, the numbers were scary. The nation’s fiscal deficit was not sustainable. Nor was the current account deficit the country had been running in its foreign trade. The COVID pandemic and rising nationalism have further dented the economic integration process as the sheer number of trade barriers and tariffs have multiplied in the US and abroad.
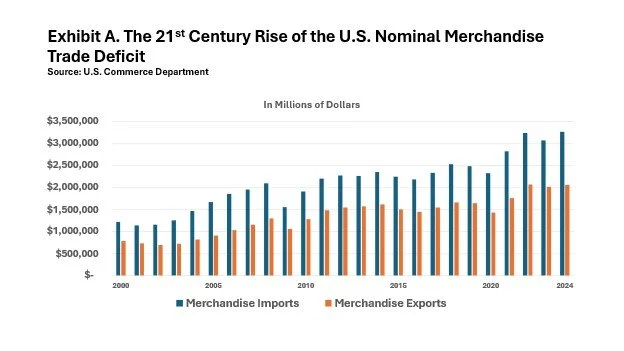
Decades of efforts to promote exports had been less than successful. Exhibit A graphically depicts in nominal dollar terms the growing asymmetry between our merchandise imports and our exports.
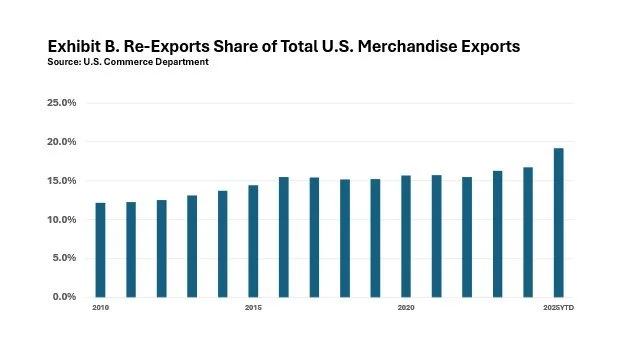
It’s actually worse than it looks. The inability of U.S. merchandise exports to keep pace with our burgeoning demand for imported goods is even more acute when one accounts for re-exports.
Exhibits B reveals an increasing share of our nominal export trade in recent years include goods that were not manufactured, grown, mined or otherwise produced in the United States. These comprise the category of goods known as re-exports. As defined by the U.S. Commerce Department, these are goods that had previously been imported and then subsequently exported, without having undergone any material changes or value-added during their stay in this country.

Exhibit C adjusts the export numbers to compensate for price inflation and broad currency fluctuations to yield the real export values of containerized exports, expressed here in chained 2017 dollars. What this shows is that the value of America’s containerized export trade was peaking in the years immediately preceding the pandemic’s disruption of global trade.
These value numbers are consistent with the recent history of the volume of loaded TEUs being shipped out from major U.S. West Coast ports.
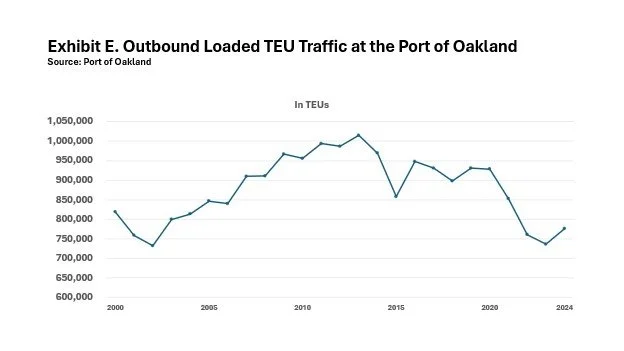
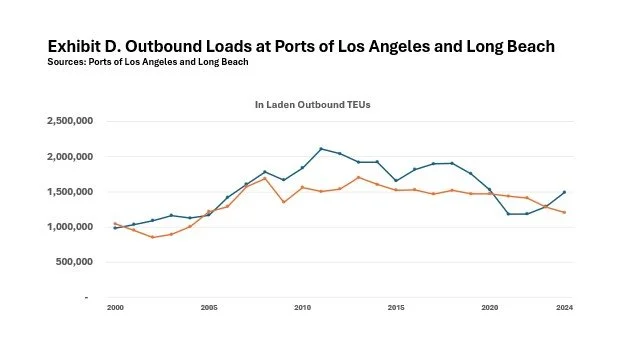
Exhibit D displays the volume of outbound loaded TEUs shipped from the Ports of Los Angeles and Long Beach over the past quarter century.
Shipments of outbound loads at the Port of Los Angeles crested in 2011 at 2,109,394 TEUs. At the neighboring Port of Long Beach, the peak occurred at 1,704,924 in 2013, the year in which combined outbound traffic from the two San Pedro Bay ports reached its all-time high. By comparison, last year’s San Pedro Bay traffic in outbound laden TEUs was down 25.5% from 2013.
Much the same was the case at the Port of Oakland, as Exhibit E indicates. The San Francisco Bay port recorded its top year for laden outbound containers back in 2013 at 1,014,796 TEUs. Last year’s total was 23.5% below that mark. At the Northwest Seaport Alliance, the Ports of Seattle and Tacoma have been blending their cargo statistics since 2013. As Exhibit F displays, the highest volume of export loads sailed from the two ports was in 2016, when 54.7% more loaded export TEUs left the ports than last year.

Elsewhere in this month’s West Coast Trade Report, there is a table showing that outbound loaded TEUs from the U.S. West Coast ports in September 2025 were down 22.2% from the same month on 2019. However, it is hardly a phenomenon restricted to America’s West Coast ports.
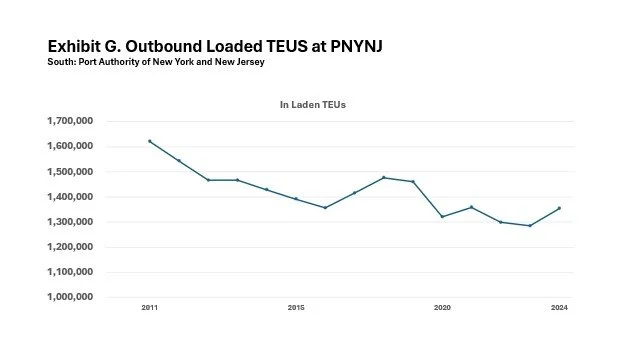
As Exhibit G demonstrates, the Port of New York/New Jersey, the largest container port on the East Coast, has experienced a similar decline in outbound loaded TEUs since recording an apparent peak in 2011. The peak is apparent only because PNYNJ does not distinguish outbound loads from outbound empties in the years before then.
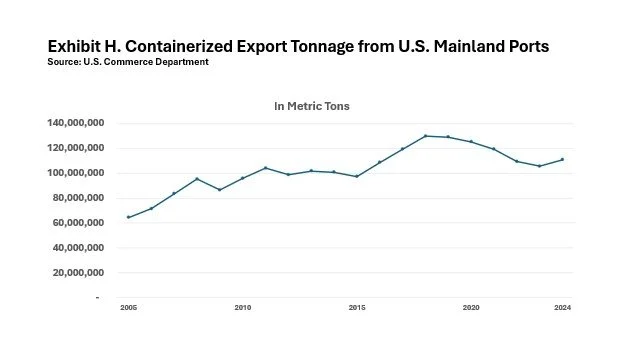
As Exhibit H conclusively attests, overall containerized export tonnage shipped from U.S. has been waning since 2018. And, although the graph suggests an upswing in 2024, containerized export tonnage from Mainland U.S. ports through the first three quarters of this year have been down by 0.7% from that preceding year.
What is especially noteworthy about these downward trend lines is that they parallel a period in which the nation’s growing inbound container trade fairly saturated the landscape with empty containers which in turn drove down the cost of shipping loaded containers overseas. Why American businesses were unable to seize these advantages to bolster the nation’s containerized export trade would certainly appear to be a topic fit for further exploration.