Ferrous Metals Containerized Trade
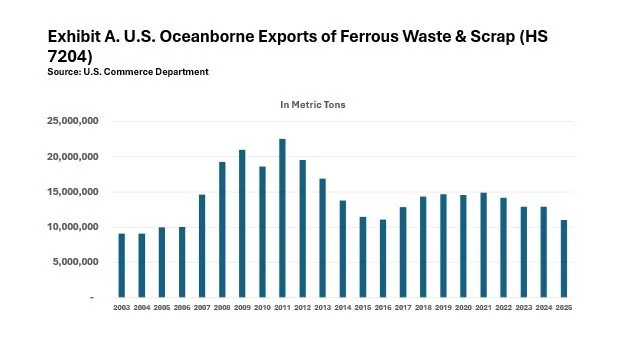
Historically, much of what America exports by sea are items sourced from farmyards and junkyards. But that’s been changing in recent years as oceanborne shipments of Ferrous Waste & Scrap (HS 7204) have been receding from their volumes of a dozen years ago. See Exhibit A.
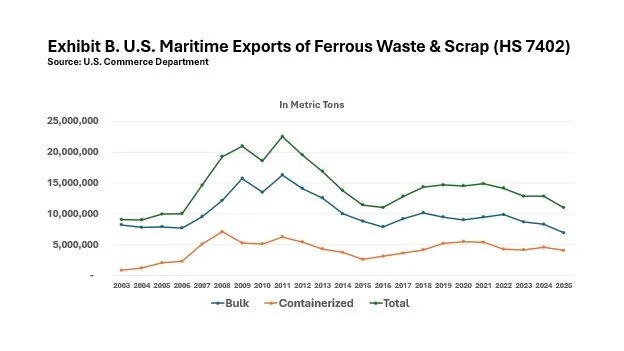
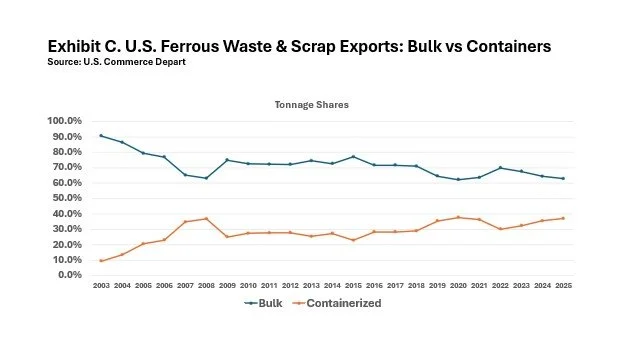
There was also a time when nearly all of the Ferrous Waste & Scrap exported from U.S. seaports was shipped in bulk. Back in 2003, for example, bulk shipments accounted for 90.7% of the commodity’s tonnage shipped overseas. Over the past ten years, an average of 33.1% of the Ferrous Waste & Scrap exported from U.S. seaports was containerized. However, recent years have seen a significant uptick in the portion of the trade shipped in containers, with a 37.1% share in 2025 compared to a 9.3% share in 2003.
Nationally, the number of tons of HS 7204 exported by sea has declined, especially as certain formerly large customers have shied away from U.S. scrap metals.
It is also a trade in which other western industrialized economies are not among our principal customers. Last year, the leading destination of U.S. scrap metal shipments was Turkey, with a 33.3% share of the metric tons of Ferrous Waste & Scrap shipped from U.S. ports. Bangladesh accounted for a 12.6% share, while Mexico (11.5%), India (9.9%), Taiwan (8.9%), Vietnam (7.6%), Thailand (6.4%), Peru (4.5%), Pakistan (3.9%), and Greece (3.6%) rounded out the Top Ten overseas markets for America’s HS 7204 exports.
Twenty years ago, China was the foremost destination. In 2005, China absorbed 36.9% of the 9,952,222 metric tons of Ferrous Waste & Scrap that departed U.S. ports. Last year, it imported just 0.04% of the export trade.
The leading port of departure for HS 7204 last year was the Port of New York/New Jersey with a 20.5% share of all Ferrous Waste & Scrap exports shipped by sea. The Ports of Los Angeles and Long Beach accounted for 16.9% of the trade, followed by the Port of Oakland with an 11.3% share. MassPort’s Conley Terminal held a 5.8% share, while Port Houston accounted for 5.1%, just edging out the Northwest Seaport Alliance’s 5.0% share.
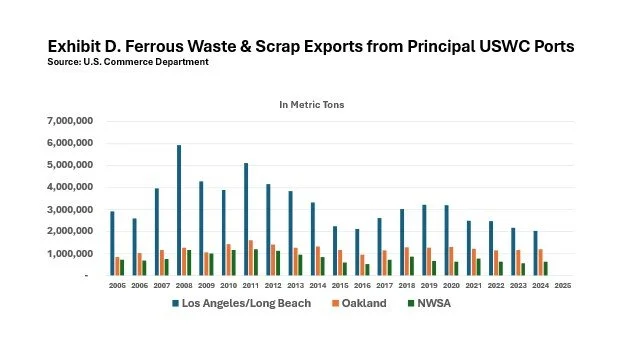
As for U.S. West Coast ports, Exhibit D testifies to the overall decline in export volumes from earlier in this century.
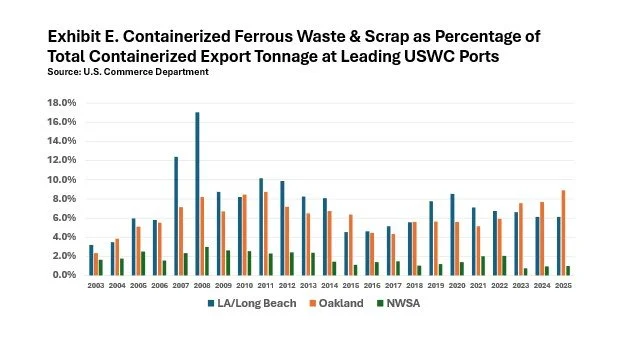
Containerized exports of Ferrous Waste & Scrap constitute varying shares of the overall containerized export trades of the three primary USWC maritime gateways, as Exhibit E reveals.