Halftime Report of the First-Half 2026 U.S. Container Trade: Port Rankings, Pacific Coast Trends, and Cargo Value
Laden TEUs at Top Five U.S. Container Ports: 2019-2026
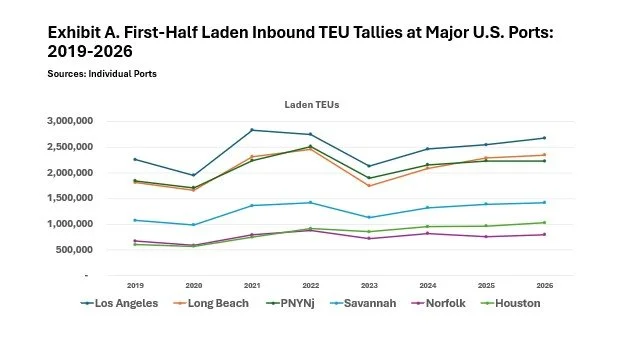
In this segment, we review the first-half of 2026b container traffic figures for the nation’s five busiest container ports. Their trend lines since 2019 follow a familiar pattern as the impact of the COVID-19 pandemic. As Exhibit A depicts, volumes fell early on in 2020 as the shutdowns and other restrictions abruptly imposed by governments worldwide rattled economies and snarled supply chains. Then, at least in the U.S., demand for imported merchandise rebounded in 2021, leading to unprecedented volumes of inbound laden TEUs. Although inbound loads subsided in the first half of 2022 at the San Pedro Bay ports due to vessel congestion, that was not the case at the four other major gateways. The first six months of 2023 saw traffic in inbound laden TEUs at the two Southern California ports actually slide to below the levels the two ports had each handled in pre-pandemic 2019. From that point, however, Los Angeles, Long Beach, and all of the major ports have recorded substantial growth in inbound loads. Compared to the first half of 2019, inbound loads in this year’s first half were up 70.3% at Port Houston; 32.1% at the Port of Savannah; 29.5% at the Port of Long Beach; 20.8% at the Port of New York/New Jersey; and 18.4% at the Port of Los Angeles.
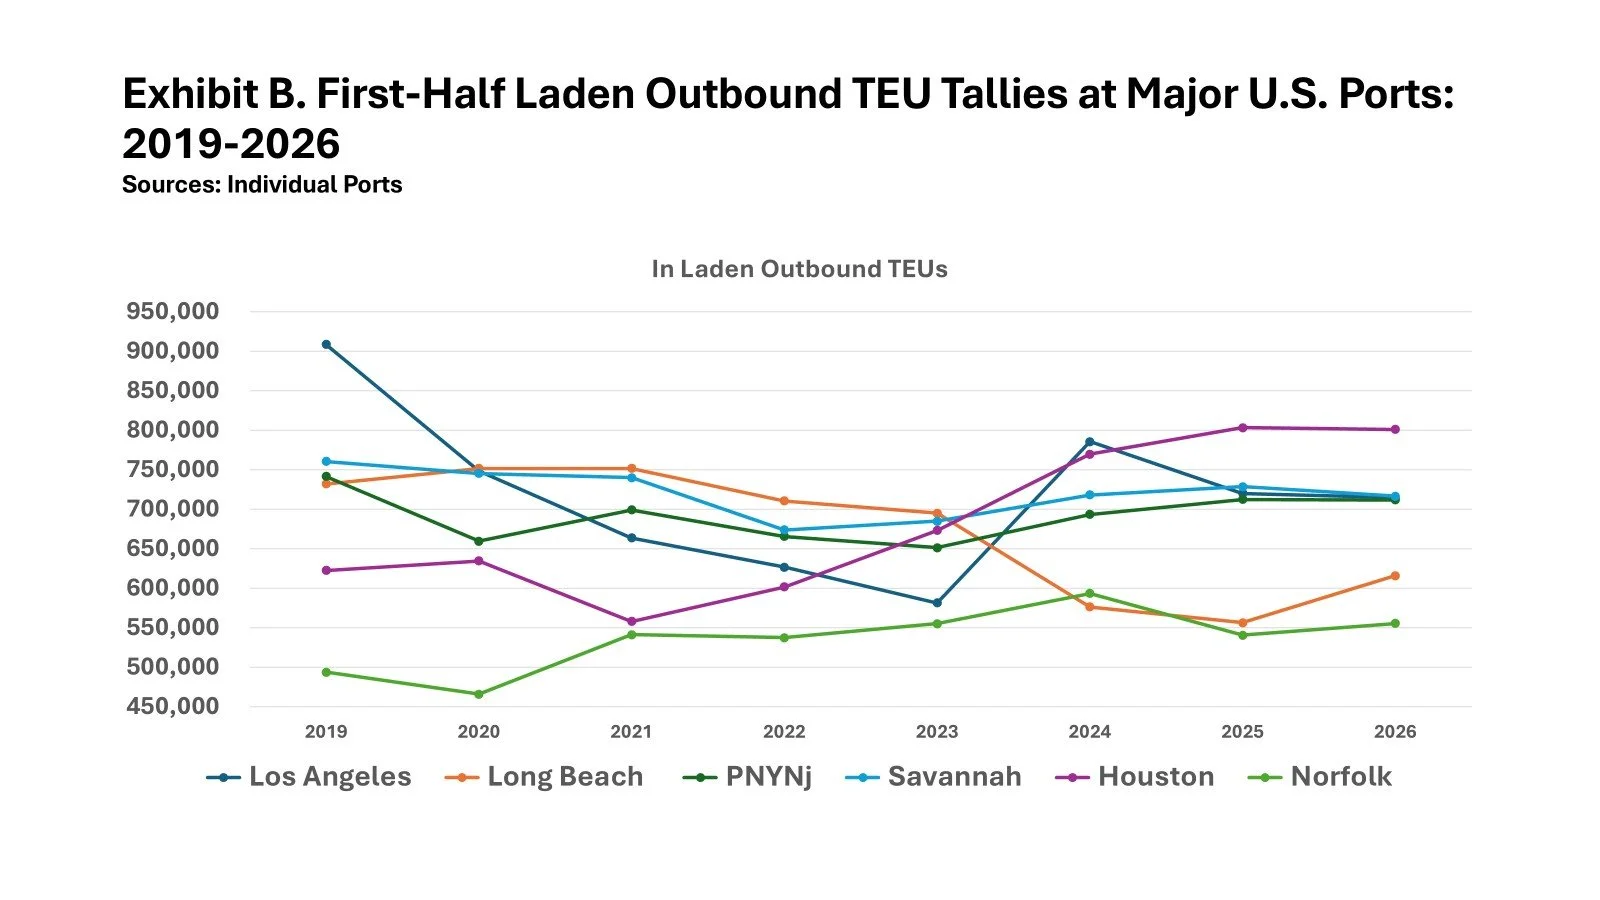
Exhibit B displays how the same six ports fared on the outbound side of the ledger. The numbers are smaller and have tended to grow even smaller over time, except at Port Houston and Norfolk. In the first half of 2026, the Ports of Los Angeles (-21.3%), Long Beach (-15.9%), New York/New Jersey (-4.0%), and Savannah (-5.8%) each shipped fewer loaded TEUs than they had in the first six months of pre-pandemic 2019. By contrast, Port Houston had achieved a 28.7% boost in outbound loads while Virginia’s Port of Norfolk registered a 12.5% gain.
Sizing Up the Box Trade at the Major Pacific Coast Ports
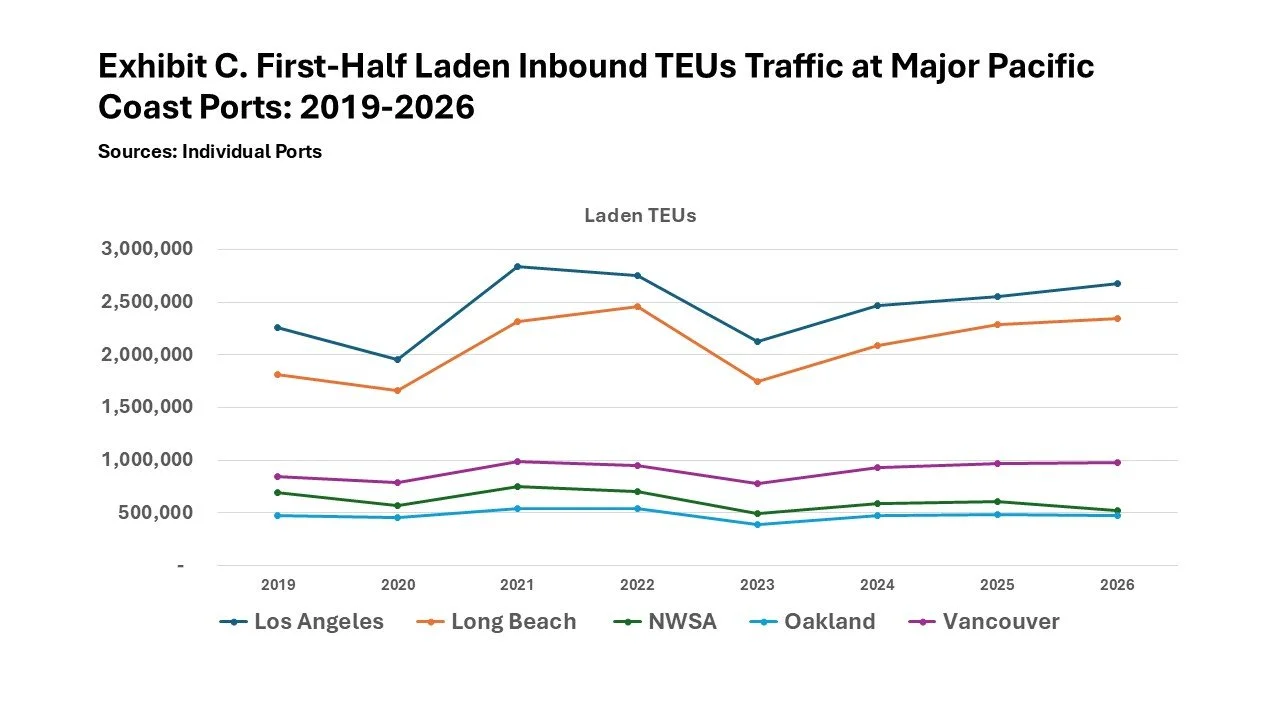
Of the five major Pacific Coast maritime gateways, Exhibit C reveals thatonlythree grew their inbound laden TEU numbers between the first half of 2019 and the first sixth months of 2026. They were the Port of Long Beach (+29.5%), the Port of Los Angeles (+18.4%), and the Port of Vancouver (16.1%). Meanwhile, the Port of Oakland staying nearly even with a slight 0.1% drop as it discharged 287 fewer laden TEUs in this year’s first half than it did in the same period in 2019. The sharpest plunge in volume came at the Northwest Seaport Alliance Ports of Tacoma and Seattle, which sustained a 24.9% drop in inbound laden TEUs between the first six months of this year and the same months in 2019. Altogether, though, the five principal Pacific Coast gateways handled 912,930 more inbound loads in the latest half-year and the same period seven years ago.
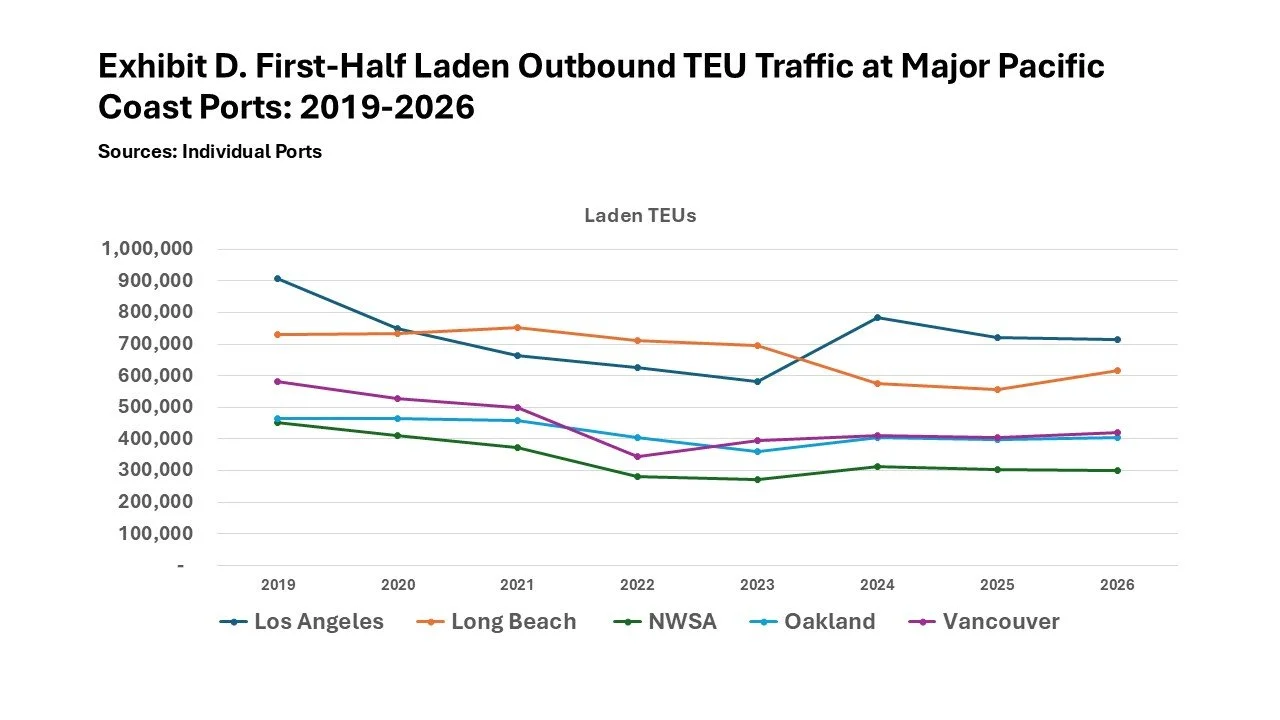
As Exhibit D illustrates, all Pacific Coast ports recorded a substantial recession in outbound laden TEU traffic between the first half of 2019 and the first half of this year. Outbound loads from the Port of Los Angeles fell by 21.3%, while the neighboring Port of Long Beach sustained a 15.9% fall-off. Outbound loads were also down at the Port of Oakland (-12.6%), at the Northwest Seaport Alliance (-34.0%), and across the border at the Port of Vancouver (-27.6%). Collectively, the six ports handled 683,500 fewer outbound loads in this year’s first six months than they had in the same period seven years ago.