
The Real Drivers of the U.S. Import Trade: Plucky Consumers or Corporate Purchasing Managers?
By Jock O’Connell
Remember the wave of imports that walloped America’s ports starting in the spring of 2020 as the COVID-19 pandemic upended global supply chains and domestic consumption patterns?
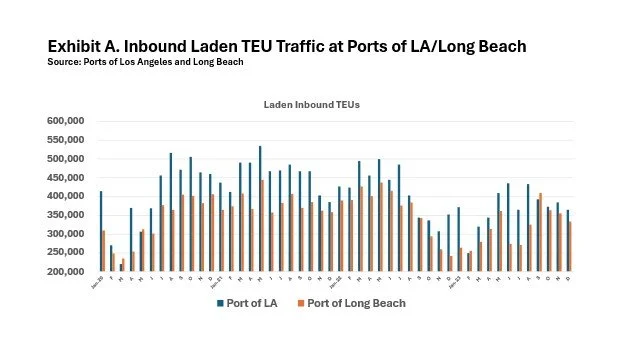
Exhibit A should help remind us of how that episode played out, at least at the Ports of Los Angeles and Long Beach, the nation’s busiest gateway for containerized trade.
Back then, the nation’s major news networks became enamored of airing videos of the armada of cargo vessels anchored off the Southern California coast. As news helicopters hovered overhead, reporters regularly posed before a backdrop of shipping containers and towering cranes while breathlessly emoting about the valuable cargo stranded offshore and the plight of the farmers whose exports of perishable produce were stuck on the docks.
Since then, news editors in New York and Washington, D.C., have apparently never lost their fascination with using imagery from the two San Pedro Bay ports. Even as the drama on the docks subsided as the pandemic waned, national and even international media outlets continued to employ visuals of container traffic through the two ports when reporting on nearly every development affecting global trade, effectively implying that those two ports may provide an accurate barometer of America’s foreign trade and the resiliency of its global supply chains.
In one way or another, we have all obliged the media’s obsession by neatly packaging statistics on containerized oceanborne commerce and offering regular briefings on port operations that feature authoritative commentary. It’s almost enough to say that, if you want to understand global trade, you need look no further than the maritime commerce passing through the San Pedro Bay ports. As one news correspondent has enthused, container flows are the key to understanding global trade because “containers don’t lie”.
Now, at this point, I suspect you are not wondering why God created economists. Well, she did, and this is our moment. Cue the hard data.
While ships and ports most certainly do the heavy lifting, most of what we think we know about America’s foreign trade is wrong. For starters, the value of all containerized imports that arrived at U.S. seaports in 2025 amounted to $990.237 billion. Impressive, certainly. But it was exceeded by the $1.155 trillion of merchandise imports that arrived by air. Meanwhile, another $836.056 billion in imports entered the U.S. overland via border crossings with Mexico and Canada.
America’s foreign trade is clearly not something that can be measured only in TEUs, which is still not a negotiable currency.
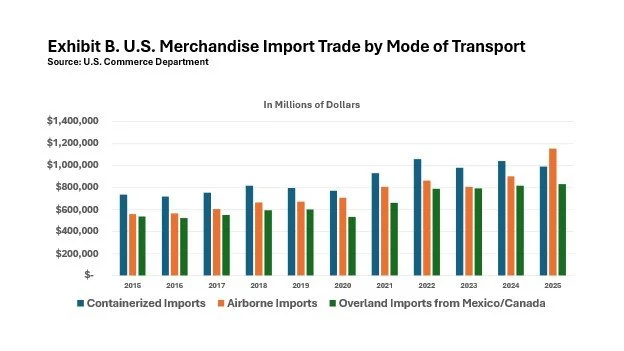
Exhibit B shows how closely the value of imported merchandise arriving at the nation’s airports has tracked the value of containerized imports entering U.S. seaports over the past decade. Last year was the first in the last ten years that airborne import values exceeded containerized maritime imports. Just under ten percent of all imports in 2025 were non-containerized.
In the first half of this year, aviation’s lead as a mode of import traffic has continued, with airborne shipments into the U.S. accounting for $587.598 billion of America’s imports, while containerized imports discharged by the country’s seaports were valued at $473.149 billion. At the same time, somewhat over one-fourth of U.S. imports came from Mexico and Canada, a trade that is more than 90% overland. In the first half of 2026, imports from our two neighbors constituted 28.5% of all imports.
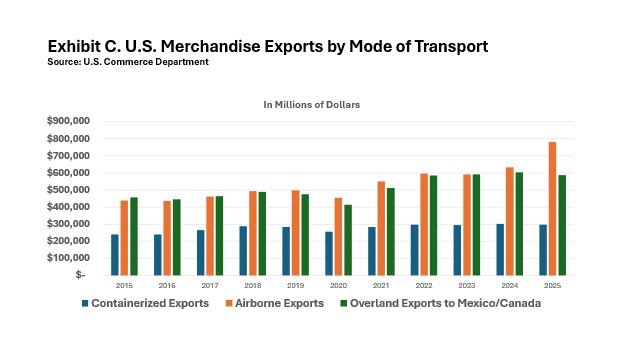
Exhibit C displays the dominant roles that airfreight and overland transport play in America’s merchandise export trade.
“Look under the hood,” as Geoffrey Goodwin, my late tutor at the London School of Economics was wont to advise his students a half century ago. (Actually, he used the term ‘bonnet’ but I have taken the liberty of translating from the original English.)
So, let’s take an even deeper peek at the detailed trade data.
Statisticians at the U.S. Census Bureau’s Foreign Trade Division (FTD) and the U.S. Commerce Department’s Bureau of Economic Analysis (BEA) are still responsible for independently compiling the nation’s official foreign trade statistics. Among the more illuminating statistical tables they produce each month is a breakdown of merchandise imports by six principal end-use categories.
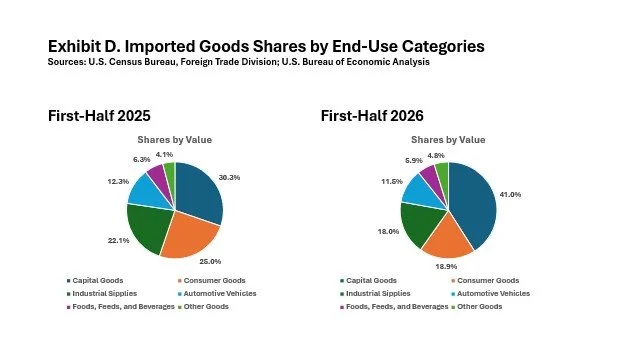
As Exhibit D reveals, it’s Capital Goods rather than Consumer Goods that constitute the leading end-use category for imported merchandise. As defined by the U.S. Commerce Department’s Bureau of Economic Analysis, Capital Goods encompass the raw materials, machinery, and components that U.S. businesses require to manufacture products. A related end-use category, Industrial Supplies, is defined by BEA as covering “non-consumer goods used as inputs in production, manufacturing, and operating processes”.
Last year, Capital Goods and Industrial Supplies together accounted for 53.5% of the nation’s $3.415 trillion merchandise import bill. By comparison, imports of Consumer Goods in 2025 totaled $800.798 billion, a 23.4% share of the nation’s merchandise import trade. Imports of Automotive Vehicles represented a 12.8% share, while Foods, Feeds, and Beverages contributed a 5.6% share. No end-use of some 4.9% of imports in last year’s first half could be determined.
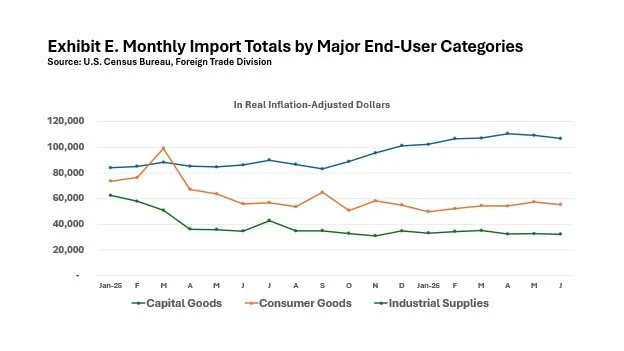
Sharper eyes perusing Exhibit E may detect significant year-over-year changes in the shares of imports allocated by their End-Use categories. Capital Goods in the first half of this year accounted for 41.0% of imports, up from 33.5% in the same period a year earlier. Meanwhile, the share of imports attributed to Consumer Goods declined from 23.7% in 2025 to 18.9% in this year’s first half.
How can this be?
The immediate answer is that the broad import surge of the past few months was not driven primarily by retailers importing Consumer Goods. Focusing just on the last three months for which data are available (April-June), the value of Capital Goods imports rose by 40.2% over the second quarter of last year, while the value of Consumer Goods imports actually declined by 9.7%, falling to $173.722 billion from $192.287 billion.
These numbers cannot be gleaned from counting the TEUs on the Southern California docks alone. In fact, Exhibit F might be something of a cold statistical shower, considering that seaborne containerized imports accounted for 29.0% of all U.S. merchandise imports last year. In the first half of this year, that share declined even further to 26.8%.
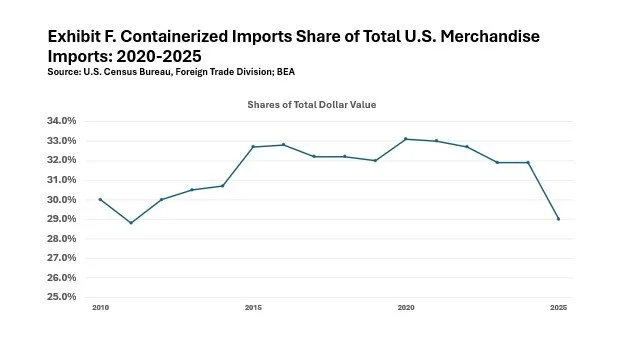
In real terms, the frontloading boom in TEUs in the latest quarter appears to have been driven largely by the folks in purchasing departments across corporate America who needed to get their large and frequently big-ticket orders safely ashore before July 24. Meanwhile, although containers filled with consumer goods had been flooding U.S. ports this spring, the items in those laden TEUs were getting cheaper for a variety of reasons. Prominent among those reasons is that retailers have been importing higher volumes of lower priced merchandise that are likely to be more attractive to America’s growing ranks of persnickety bargain hunters.
To recap, while a disproportionate share of the nation’s imports of Consumer Goods is still trafficked through seaports, it should not be inferred that consumers have been primarily responsible for the recent front-loading surge across all modes of transport. Recent upswings in imports -- the front-loading phenomenon everyone is talking about -- were manifestly driven by the anticipation of the new set of tariffs. But every importer, especially those ordering complex, highly priced industrial machinery, had ample reason to get their goods passed the Customs Office before July 24.
As for those plucky American consumers, they certainly contribute to the tides of imports washing up on our shores, but their relative role in America’s overall merchandise import trade has been lately waning. That’s something an editor simply pulling up an imagine of a huge containership to illustrate an online news story about international trade might miss.
The commentary, views, and opinions expressed by Jock O’Connell are his own and do not reflect the views or positions of the Pacific Merchant Shipping Association. PMSA does not endorse, support, or make any representations regarding the content provided by any third party commentator.