October 2025 TEUs
Nearly Complete October 2025 Container Traffic Statistics
As noted above, ports are largely indifferent to our publication deadlines. Although sometimes we do not post all of the latest TEU tallies in the WCTR, we do update the following three exhibits on the PMSA website as soon as fresh numbers arrive.
Of the major U.S. West Coast (USWC) ports, the Ports of Los Angeles and Long Beach were the only ones that handled more inbound loaded TEUs during the first ten months of this year than they had in the same months in pre-pandemic 2019. Year-to-date, inbound loads at the Port of Long Beach have been up 26.9% at the Port of Long Beach and 13.0% at the Port of Los Angeles. By contrast, inbound loaded TEUs at the Port of Oakland and at the Northwsest Seaport Alliance were down 0.7% and 16.0%, respectively.
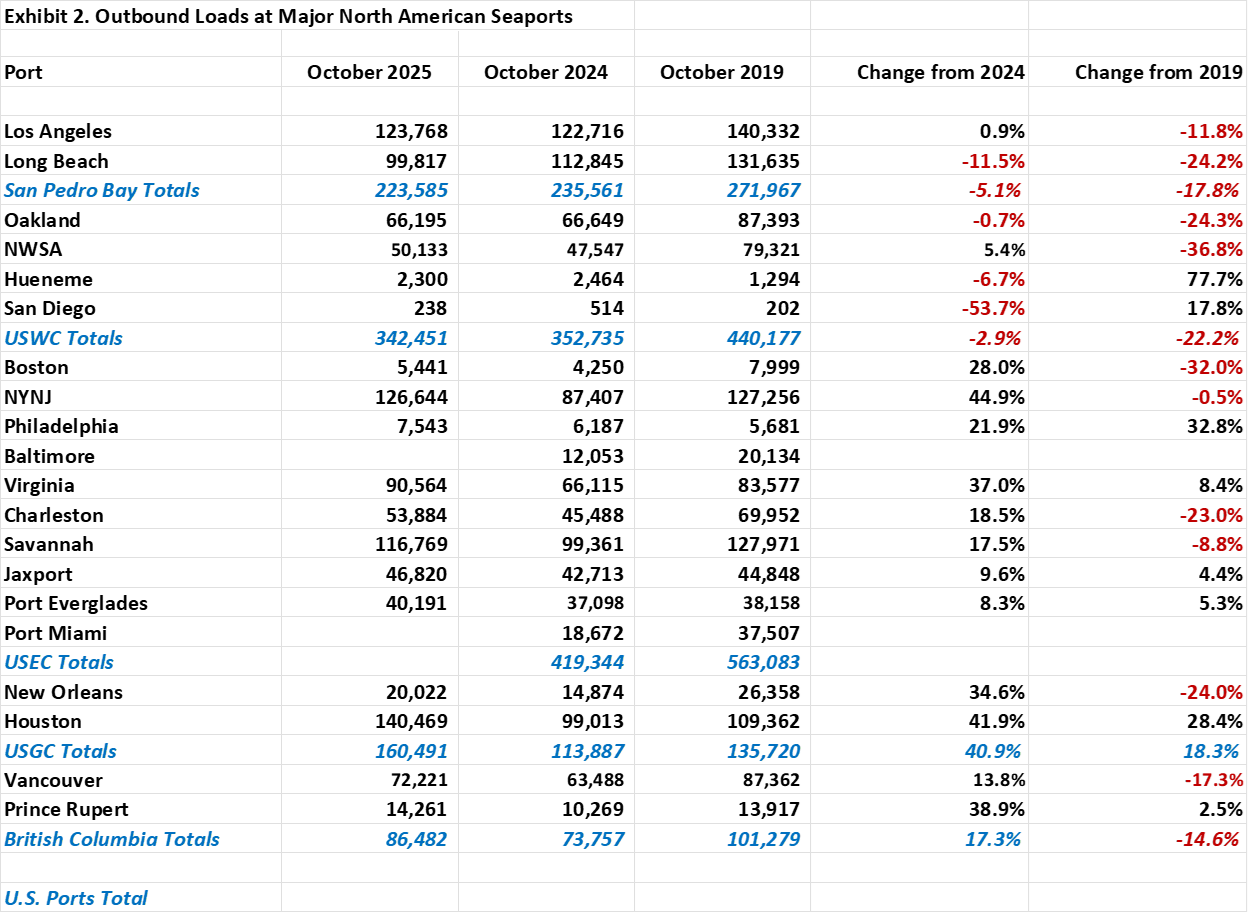
Outbound loads were a somewhat different story, as none of the America’s principal West Coast showed increased traffic. Compared to the first ten months of 2019, the number of outbound laden TEUs shipped from the Port of Los Angeles this year were off by 18.8%, while the Port of Long Beach sustained a 24.1% fall-off. Meanwhile, outbound loads were down 15.8% at Oakland and 35.0% at the Ports of Tacoma and Seattle.
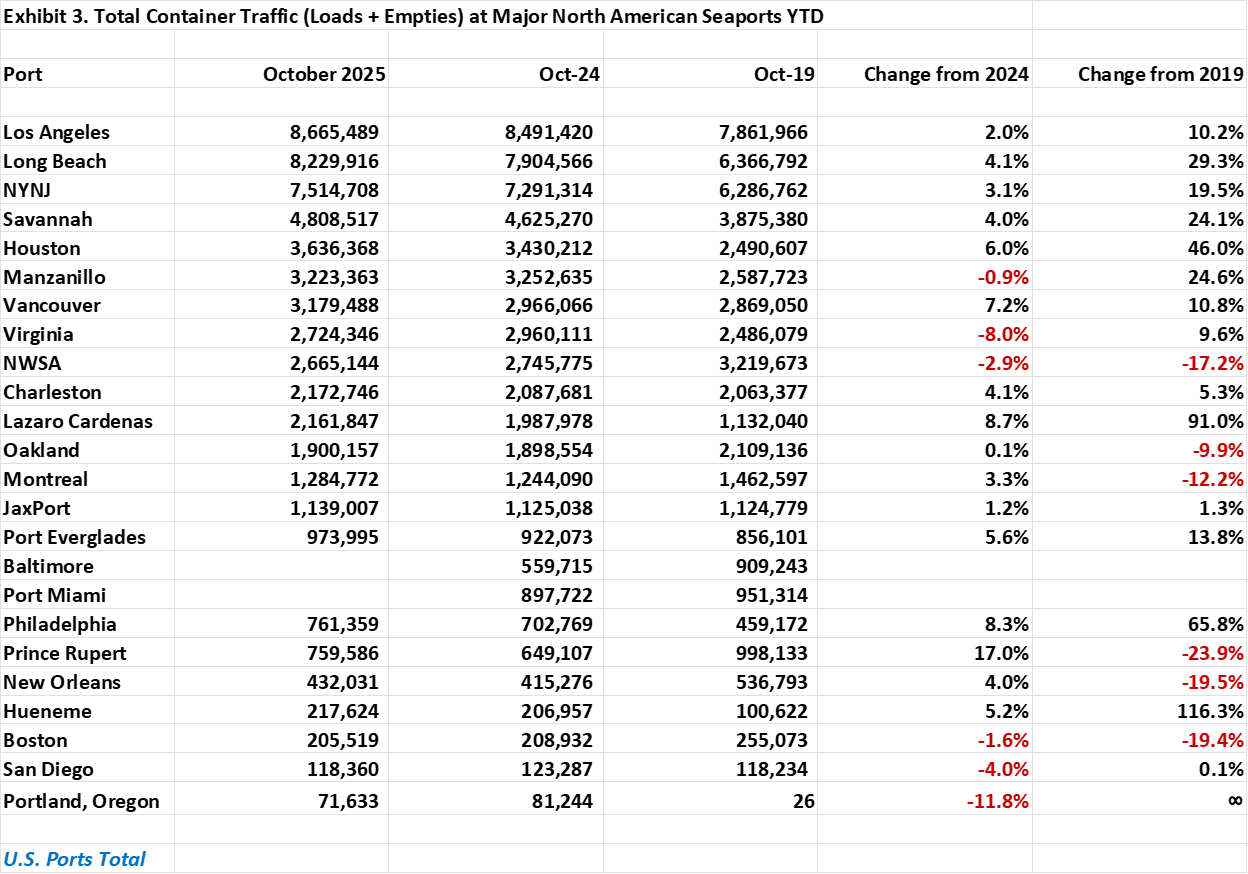
For the month of October alone, the Port of Los Angeles saw the number of inbound loads in October drop by 7.2% from a year earlier but remain 9.3% above the volume recorded in October 2019. Meanwhile, outbound loads edged up 0.9% from a year earlier to 123,768 TEUs. Total 2025 YTD container trade through the nation’s largest container gateway of 8,665,489 TEUs was up 10.2% from the first ten months of pre-pandemic 2019.
The Port of Long Beach reported 401,915 inbound loaded TEUs in October, a 17.6% fall-off from a year earlier but still a 19.2% gain over October 2019. Outbound loads, meanwhile, slipped to 99,817 TEUs from 112,845 TEUs last October. Total container traffic YTD through the Southern California port amounted to 8,229,916 TEUs, an increase of 29.3% over the same period in pre-pandemic 2019.
Together, the two ports in San Pedro Bay maritime complex saw their total volume of inbound loads drop 12.5% from a year earlier. Outbound loads sailing from the two ports in October were down 5.1% year-over-year.
The Port of Oakland handled 82,195 inbound loaded TEUs in October, a 0.9% increase over the same month last year and 4.6% more than it had discharged in October 2019. Meanwhile, outbound loads (66,195 TEUs) slipped by 0.7% from a year earlier and by 24.3% from October2019. Total container traffic through the San Francisco Bay Area port through the first ten months of this year amounted to 1,900,157 TEUs, down 9.9% from the same period in 2019, when the Northern California port still had the distinction of being the rare major seaport that exported more containers than it imported.
Oregon’s Port of Portland processed 9,131 inbound and outbound TEUs in October, the fewest in any prior October since containerized shipping at the Columbia River facility resumed in 2020. Over the first ten months of this year, container traffic at the port totaled 71,633 TEUs, down 11.8% from the same period last year, when low volumes prompted port officials to question whether container service could be profitably sustained.
The Northwest Seaport Alliance Ports of Tacoma and Seattle discharged 80,323 laden TEUs in October, a 25.2% fall-off from the previous October as well as a 26.6% plunge from the inbound loads handled by the two ports in October 2019. Outbound loads (50,133 TEUs), while up by 5.4% year-over-year, were down by 36.8% from October 2019. Total box trade through the Washington State ports YTD amounted to 2,665,144 TEUs, down 17.2% from the same period in 2019.
Across the border in British Columbia, the Port of Vancouver received 145,007 inbound loaded TEUs in October, a 2.6% dip from a year earlier but nonetheless up 6.5% from October 2019. Outbound loads meanwhile amounted to 65,550 TEUs, down 5.8% from a year earlier and off by 27.4% from October 2019. YTD, total container traffic through Canada’s busiest container port equaled 2,870,730 TEUs, up 10.6% from the same period in 2019.
At the Port of Prince Rupert, business picked up briskly in October as the port handled 41,575 inbound loads, a 44.0% bump over a year earlier but nonetheless 27.9% below the import volume the port saw in October 2019. Outbound loads of 14,261 TEUs were likewise up 38.9% from a year before but just 2.5% above the port’s October 2019 export trade. Total container traffic through the Canadian port YTD amounted to 759,586 TEUs, down 23.9% from the same period in 2019.
On the Eastern Seaboard, October saw the Port of New York/New Jersey process 368,439 inbound loaded TEUs, a 3.1% fall-off from a year earlier but an 8.5% gain over October 2019. Outbound loads through the nation’s third busiest container gateway amounted to 126,644 TEUs, a 44.9% year-over-year spike but off by 0.5% from October 2019. Total YTD box trade through the country’s top Atlantic gateway, 7,514,708 TEUs, was up 19.5% over the same months in 2019.
The Port of Virginia’s inbound traffic shows signs of stalling. While the 123,727 inbound loads discharged in October represented a 1.8% decline from a year ago, the number of inbound loads was similarly down by 0.3% from October 2019. The Mid-Atlantic Coast port fared better with its exports. Outbound loads of 90,564 TEUs were up 37.0% from a year earlier and 8.4% higher than in October 2019. Total container trade YTD amounted to 2,724,346 TEUs, up 9.6% from the first ten months of 2019.
Inbound loads through the Port of Savannah slipped 8.8% in October from the previous year to 219,528 TEUs but still remained 10.0% above the volume handled in October 2019. Outbound loads (116,769 TEUs) were up 17.5% year-over-year but down 8.8% from the same month in 2019. Total container trade YTD of 4,808,517 TEUs was up 24.1% from the first ten months of 2019.
Along the Gulf Coast, Port Houston reported 164,448 inbound loads in October, a 7.6% increase from a year earlier and a 48.7% gain over October 2019. The 140,469 outbound loads shipped from the Texas gateway in October represented a 41.9% year-over-year increase as well as a 28.4% gain over October 2019. The 3,636,368 total TEUs handled through the first ten months of this year amounted to a 46.0% gain over the same period in 2019.