
Please Repeat After Me: Loads Count More Than Empties
By Jock O’Connell, Economist
When I started out in this business of monitoring global trade, the U.S. Maritime Administration routinely measured containerized shipments in “long tons.” I’m guessing that it may no longer be common knowledge among younger economists (those under 65) that a long ton is equal to 2,240 pounds or 1,016.05 kilos. But why bother talking about how much things weigh when everyone attending all the major transportation industry conferences speaks in the more convenient parlance of TEUs?
Although the use of maritime shipping containers became increasingly widespread in the decades following their introduction by the legendary Malcom McLean in the mid-1950s, the boxes could and did come in all sizes. It would take years of expert working groups and technical analyses before all hands -- at sea and on land -- got to the same page. The International Standards Organization (ISO) did not publish its set of approved container dimensions until 1970. Even then, the Twenty-Foot Equivalent Unit or TEU did not come into regular use in U.S. waterborne trade statistics until the early 1990s.
The rise of the TEU as the maritime industry’s preferred shorthand metric has facilitated public awareness of the important economic role played by ocean carriers and seaports. Government officials and journalists are now able to reel off the latest TEU tallies with the same assuredness they cited the Dow Jones Industrial average. Unfortunately, as sometimes happens when data fall into the hands of the statistically glib, the eagerness to trot out TEU numbers can wind up distorting economic reality.
For example, just a few days ago I noticed a report in a foreign publication – one that insists that harbors are harbours -- that the Port of Long Beach is within striking distance of dislodging the Port of Los Angeles from its rank as the busiest U.S. container gateway.
What was the basis for this startling conclusion? Simply that the Port of Long Beach had handled 2,390,225 TEUs in Q1, edging out the 2,388,843 TEUs processed next door at the Port of Los Angeles by a margin of 1,382 TEUs.
The report then calculated: “With the annual gap between Long Beach and Los Angeles now measured in fractions of a single vessel call, second quarter allocations by major alliances are likely to determine whether the 25-year ranking holds through 2026”.
Balderdash!
Even though ports might like to tout their total TEU numbers, we need to remind ourselves from time to time that the nation’s maritime gateways are fundamentally in the business of transporting goods, not boxes that may be filled with nothing but air.
This is one of those times. What the offshore report did not note is the more economically relevant fact that the Port of Los Angeles is the destination of precious few empty inbound containers. Indeed, in the same quarter that impressed the publication’s editors, inbound empties at the Port of LA totaled a whopping 192 TEUs or a mere 0.4% of all inbound empty TEUs through San Pedro Bay in the first quarter.
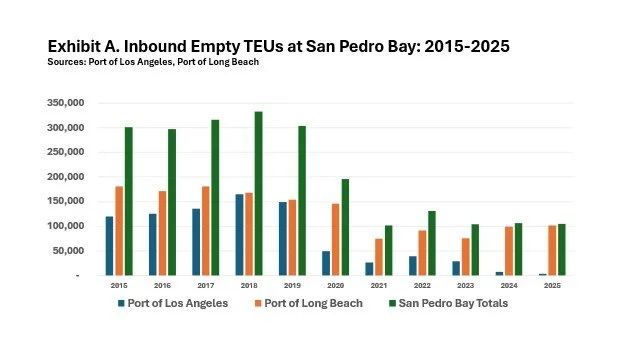
Moreover, this was hardly an anomaly, as Exhibit A attests.
With the onset of the COVID-19 pandemic in early 2020, the two ports have managed to minimize the number of inbound empty TEUs crossing their docks, with the Port of Los Angeles reducing the flow of inbound empties to a relative trickle. So, last year, the Port of Long Beach handled all but 3,793 of the 105,353 inbound empties offloaded at the two ports.
Exhibit A begs the question: Which port is actually handling more laden TEUs? You know, the TEUs which have a monetary value above the handling fees charged by stevedores.
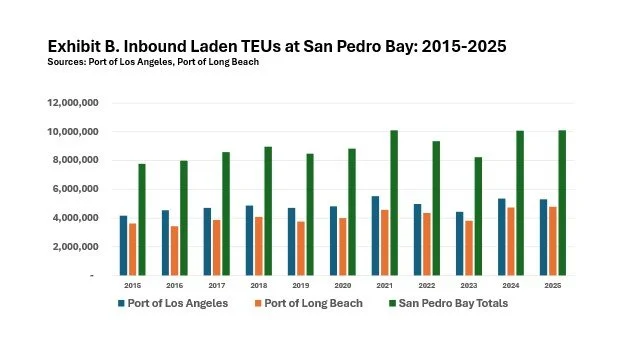
While the rival ports are very similarly situated, the answer to that question translates into a narrative that is much less alarming for the Port of Los Angeles. Exhibit B depicts the traffic in inbound laden TEUs through the two San Pedro Bay ports, while Exhibit C reveals the parallel figures on outbound laden TEUs.
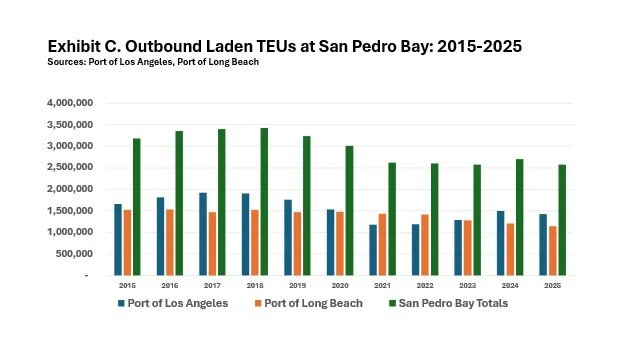
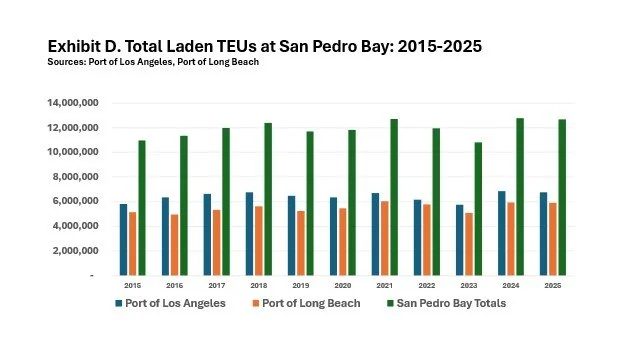
Exhibit D shows that the Port of Los Angeles has consistently handled more laden TEUs than its neighbor. Over the past decade, the percentage of the laden TEU traffic though San Pedro Bay handled by the Port of Los Angeles has ranged from a high of 56.1% (2016) to a low of 51.6% (2022). Last year, the Port of LA’s share was 53.3%.
As for this year’s first quarter, the Port of Long Beach handled 135,456 fewer laden TEUs than the Port of Los Angeles.
The commentary, views, and opinions expressed by Jock O’Connell are his own and do not reflect the views or positions of the Pacific Merchant Shipping Association. PMSA does not endorse, support, or make any representations regarding the content provided by any third party commentator.