
Preliminary July 2025 TEUs
The West Coast Trade Report is a monthly publication of the Pacific Merchant Shipping Association. It monitors container traffic through 25 North American seaports, twenty in the United States, two in Mexico, and three in Canada. The TEU tallies cited here are the actual statistics released by the ports themselves, not a priori estimates based on proprietary models or algorithms. However, as the tardy numbers become available, the Facts & Figures tables on the PMSA website will be promptly updated.
Preliminary Forecasts for July TEU Tallies
On August 8, the National Retail Federation’s Global Port Tracker issued its preliminary forecast for July, projecting that 2.3 million TEUs laden with goods from abroad would arrive at the thirteen U.S. mainland ports it surveys. That would represent a year-over-year decline of 0.5%. Meanwhile, the estimate from the Descartes Systems Group indicated that 2,621,910 TEUs arrived at all U.S. ports in July, a 2.6% increase from a year earlier.
Initial Port Volume Reporting for July
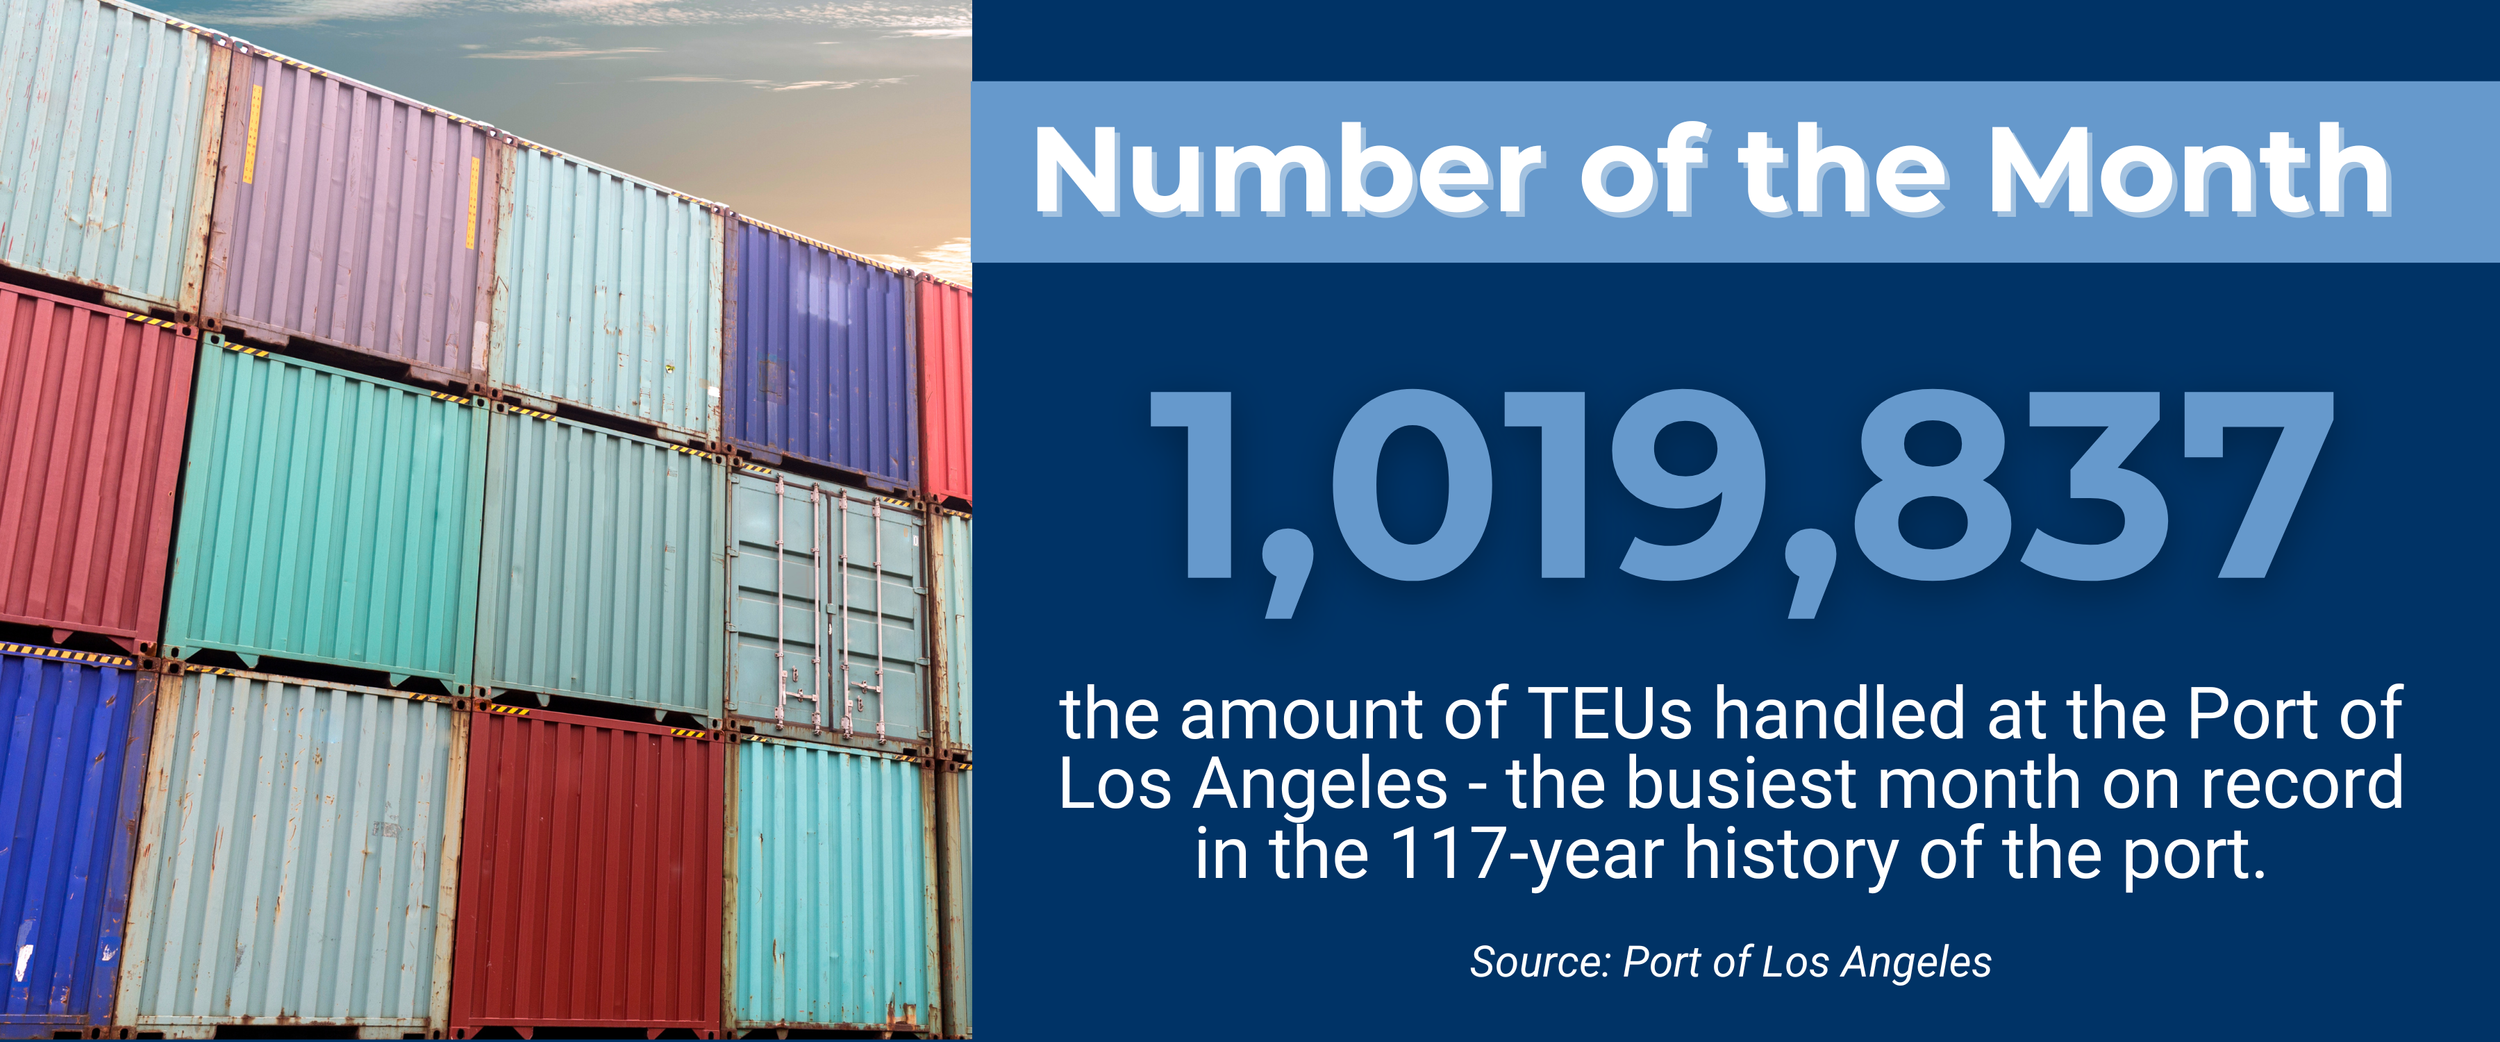
The nation’s busiest container port, the Port of Los Angeles, handled 1,019,837 loaded and empty TEUs in July. This was a record-breaking tally, the most containers that the Port of Los Angeles has ever handled in a single month. That included 543,728 inbound loaded TEUs, the most inbound loaded containers processed in any previous month. That represented an 8.5% bump in inbound loads from a year earlier and a 14.1% gain over the volume handled in July 2019. Outbound loads of 121,507 TEUs were up 5.8% year-over-year but down 24.7% from July 2019. Total container traffic through the port YTD amounted to 5,975,649 TEUs, a 9.6% increase over the same period in 2019. In an August 13 press briefing, Port Executive Director Gene Seroka commented that container flows through the port have been driven by responses to the dynamic tariff environment and may have now peaked for the year.
And the neighboring Port of Long Beach recorded its busiest July ever at 944,232 loaded and empty TEUs. Inbound loaded TEUs amounted to 468,081, a 7.6% year-over-year gain and 49.4% over July 2019’s inbound trade. However, outbound loads of 91,328 TEUs fell by 12.9% from a year earlier and were 18.2% below July 2019. Total container traffic YTD through the Southern California port amounted to 5,690,863 TEUs, up 32.1% from the same period in pre-pandemic 2019.
Together, the San Pedro Bay gateway processed 1,964,069 loaded and empty TEUs in July, including 1,011,809 inbound loaded TEUs and 212,835 loaded outbound TEUs.
At Northern California’s Port of Oakland also saw a burst in its box trade. 92,392 inbound loaded TEU were discharged in July, 15.3% jump from a year earlier, a 31.4% increase from the preceding month, and the highest monthly import total so far in 2025, although roughly on a par (+2.0%) with July 2019. Outbound loads (65,595 TEUs) in July were likewise up year-over-year by 10.5% but off by 14.2% from July 2019. Total container traffic through the first seven months of this year (1,346,022 TEUs) were 8.6% below the volume handled in the same months in 2019.
The Northwest Seaport Alliance (NWSA) Ports of Tacoma and Seattle sustained a year-over-year decline in import loads in July, with 97,683 imported laden TEUs down 11.4% from July 2024 and off by 20.5% from July 2019. Export loads in July (44,303 TEUs) were up 19.9% from the preceding July but remained down 40.0% from July 2019. Total container traffic YTD amounted to 1,885,363 TEUs, 15.9% below the volume recorded in the same period six years ago.
Over the border in British Columbia, the Port of Vancouver discharged 173,520 laden TEUs in July, 2.6% more than in the same month a year earlier and up 6.5% over the volume of July 2019. Outbound loads (60,937 TEUs), meanwhile, were just 0.3% higher year-over-year but down 33.4% from July 2019. Total YTD container traffic through Canada’s busiest seaport (2,225,813 TEUs) was up 11.5% from the same period in 2019.
Further north In British Columbia, the Port of Prince Rupert continues to fall short of its pre-Covid trade volumes. On a YTD basis, the port handled 514,866 loaded and empty TEUs this year, 9.8% more than it did in last year’s first seven months. But that still left the port 21.9% below the 659,398 TEUs the port handled in the same months of 2019. Inbound loads this July (40,759 TEUs) were up by 20.8% from a year ago but still down by 38.5% from July 2019. Outbound loads (10,075 TEUs) this July were off by 8.1% from a year earlier and by 34.6% from July 2019.
On the Eastern Seaboard, the Port of Virginia reported 128,652 inbound loaded TEUs in July, a 12.4% fall-off from a year earlier but a 2.7% gain over July 2019. Outbound loads (81,132 TEUs) were also down 12.4% while up 0.2% over July 2019. Total container traffic through the first seven months of this year (1,900,223 TEUs) were up 11.5% from the same period six years earlier.
Elsewhere on the Mid-Atlantic Coast, the Port of Charleston saw its container traffic slip in July. Inbound loads (105,870 TEUs) were down 7.5% from a year earlier but up by 14.2% over July 2019. Outbound loads from the South Carolina gateway (49,390 TEUs) were off by 3.9% year-over-year as well as 31.5% below the inbound volume recorded in July 2019. Total container traffic YTD (1,523,374 TEUs) represented a 7.4% increase from the first seven months of 2019.
The two Pacific Coast Mexican ports we track, Manzanillo and Lazaro Cardenas, saw their collective volume of import loaded containers in July (201,916 TEUs) drop by 9.9% from a year earlier, while their combined export loads (30,108 TEUs) rose by 4.2% year-over-year.
Container traffic statistics for July from the Port of New York/New Jersey, the Port of Savannah, and Port Houston were not yet made available by our publication deadline.