September 2025 TEUs
Complete September 2025 TEU Numbers
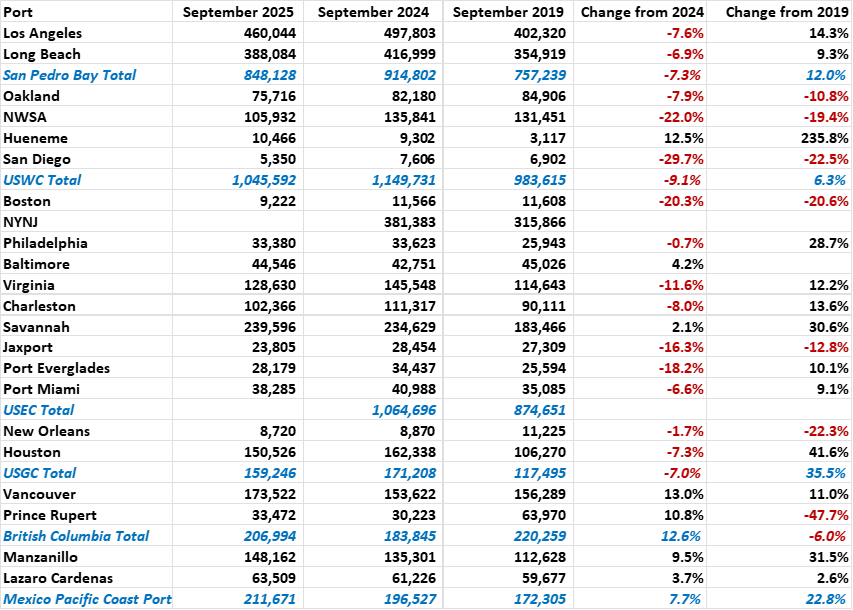
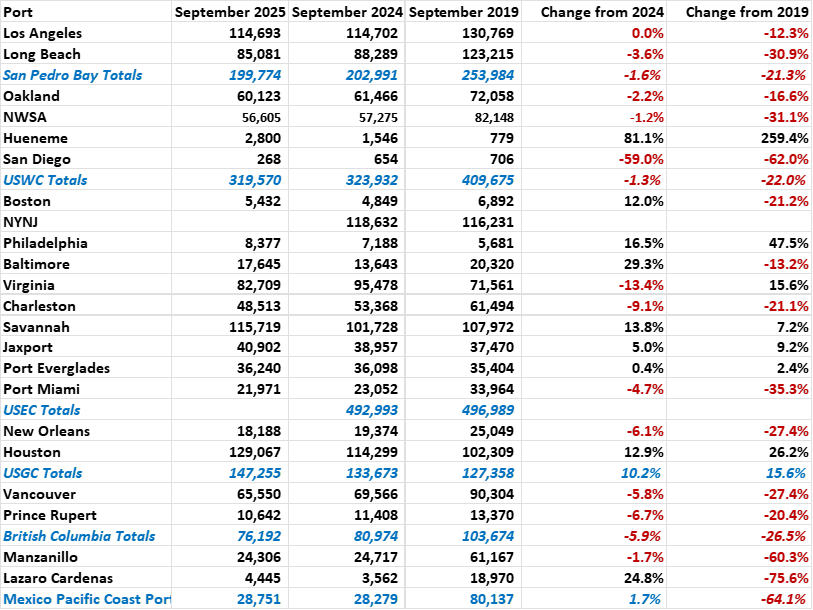
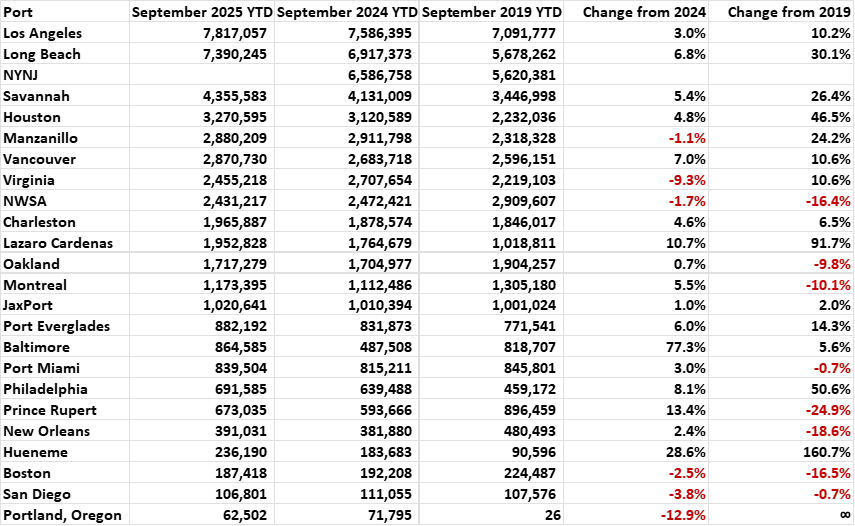
The Port of Los Angeles saw a year-over-year downturn in container traffic in September, with the 460,044 inbound loads handled by the Southern California gateway down 7.6% from a year earlier and outbound loads of 114,693 TEUs a shade off the 114,702 TEUs shipped from the port last September. Total container movements through America’s busiest container port through the first three quarters of this year amounted to 7,817,057 loaded and empty TEUs, up 10.2% over the same nine months in pre-pandemic 2019.
The neighboring Port of Long Beach discharged 388,084 laden TEUs in the year’s ninth month, a decline of 6.9% from a year earlier but a 9.3% improvement over September 2019. Outbound loads amounted to 85,081 TEUs, down not only 3.9% year-over-year but 30.9% below the volume handled in September 2019. Total YTD container traffic through September (7,390,245 TEUs) represented a 6.8% gain over the same period in 2019.
In the San Francisco Bay, the Port of Oakland continues to handle fewer containers than it had in pre-pandemic 2019. The 75,716 inbound loaded TEUs discharged this September were down 7.9% from a year earlier and down by 10.8% from September 2019. Outbound loads (60,123 TEUs) were off by 2.2% year-over-year and by 16.6% from September 2019. Total container traffic YTD amounted to 1,717,279 TEUs, 9.8% below the volume handled in the first three quarters of 2019.
Oregon’s Port of Portland continued to post disappointing figures in September with 5,098 inbound TEUs, down 43.6% from a year earlier and by far the fewest since container operations resumed at the port’s Terminal 6 in 2020. The 2,598 outbound TEUs that sailed from the Columbia River port were down 43.2% from September 2024. Total container traffic through the port in this year’s first nine months amounted to 32,765 TEUs, down 35.2% from the same period last year.
Ports in the Pacific Northwest had sharply varying experiences in September, with sharp declines in inbound loads south of the border in Washington State and robust increases over the border in British Columbia.
The Northwest Seaport Alliance Ports of Tacoma and Seattle recorded 105,932 imported loaded TEUs in September, down 22.0% from a year earlier as well as off 19.4% from September 2019. Export loads (56,605 TEUs) were down by 1.2% year-over-year and 31.1% below the volume handled six years ago. Total container traffic through the Puget Sound ports through the first three quarters of this year amounted to 2,431,217 TEUs, 16.4% below the volume handled in the same period in 2019.
Across the border in British Columbia, the Port of Vancouver handled 173,522 inbound loads in September, a 13.0% bump from a year earlier and an 11.0% gain over September 2019. Outbound loads amounted to 65,550 TEUs, down 5.8% year-over-year and 27.4% below the mark set in September 2019. Total container traffic through Canada’s busiest seaport so far this year came to 2,870,730 TEUs, a 10.6% gain over the same months in 2019.
The Port of Prince Rupert handled 33,472 inbound loaded TEUs in September, a year-over-year gain of 7.5% but 47.7% below the volume recorded in September 2019. The 10,642 loaded TEUs that sailed from the port in September, a 6.1% decline from a year earlier as well as a 20.4% falloff from September 2019. Total YTD container traffic through the British Columbia port amounted to 673,035 TEUs, 24.9% below the volume handled in the first three quarters of 2019.
Along the Mid-Atlantic range, the Port of Virginia posted the arrival of 128,630 inbound loaded TEUs in September, an 11.6% drop from the year before but a 12.1% improvement over September 2019. Outbound loads (82,709 TEUs) were likewise off by 13.4% year-over-year but up 15.6% over September 2019. Total container trade through the first nine months of this year amounted to 2,455,217 TEUs, up 10.6% from the same period in 2019.
South Carolina’s Port of Charleston recorded 102,366 inbound loaded TEUs in September, down 8.0% from a year earlier but up 13.6% from September 2019. Outbound loads (48,513 TEUs) were down 9.1% year-over-year and 21.1% below the volume of September 2019. Total container traffic through the port during the first three quarters of this year amounted to 1,965,887 TEUs, up 6.5% from the same period in 2019.
The Port of Savannah handled 239,596 inbound loaded TEUs in September, up 2.1% from a year earlier and 30.6% over the volume discharged in September 2019. The 115,719 outbound loads shipped from the Georgia port in September represented gains, respectively, of 13.8% and 7.2% from September 2024 and September 2019. Total box trade YTD through the nation’s fourth busiest container port amounted to 4,355,583 TEUs, an increase of 26.4% over the first three quarters of 2019,
Along the Gulf Coast, Port Houston reported 150,526 inbound loaded TEUs in September, down 7.3% from a year earlier but up 41.6% from September 2019. Outbound loads at the Texas port meanwhile amounted to 129,067 TEUs, a 12.9% year-over-year gain and a 26.2% improvement over September 2019. Total container traffic in the first three quarters of this year equaled 3,270,595 TEUs, up 46.5% over the same period in 2019.