
The Lumpy USWC Share of Recent U.S. Container Trade
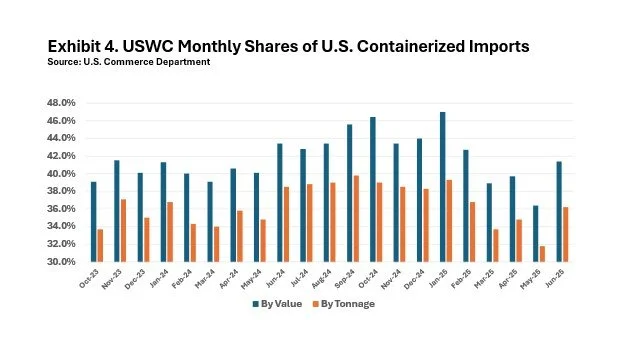
As Exhibit 4 reveals, the past year has seen substantial shifts in the coastal shares of America’s inbound container traffic. This exhibit’s chart starts in October 2023, when Houthi attacks on vessels in the Red Sea began to affect the routes shipping lines used to deliver containerized goods to U.S. ports. Then, by early last summer, the risk that a labor dispute might close East and Gulf Coast ports in September caused shippers to redirect container traffic away from the threatened ports. As a result, the USWC share of all U.S. inbound container tonnage rose, especially in the second half of 2024, before sliding from 39.3% in January to 31.8% in May. At that point, uncertainties about future tariff rates drove importers to load up on inventory. By June, the resulting surges of imports, chiefly from East Asia, reversed that trend. Preliminary TEU numbers for July strongly indicate that America’s West Coast ports continued to see an elevated share of the market in that month.
June’s bump in the UWSC share of the nation’s containerized import trade over the preceding month was largely due to a 14.2% increase in containerized tonnage at the Port of Los Angeles and Long Beach and a smaller 6.5% increase at the Northwest Seaport Alliance Ports of Tacoma and Seattle. The Port of Oakland actually sustained a 14.5% fall-off in import tonnage from May to June, while nationally containerized import tonnage fell by 4.1% from May to June. (We should observe, however, that Oakland recorded a remarkable 31.4% jump in inbound loaded TEUs from June to July that is likely to be offset by a commensurate fall-off in traffic from July to August.)
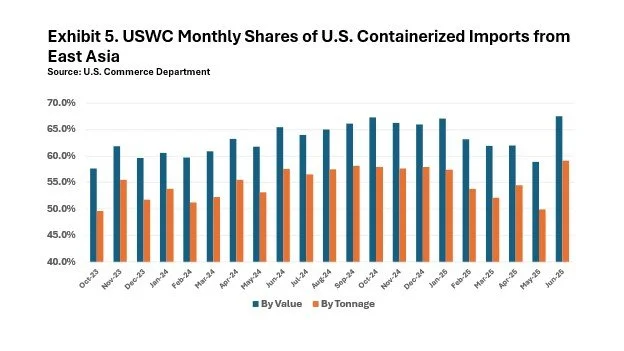
Exhibit 5 illustrates a parallel experience with containerized imports from East Asia. In January, USWC ports handled 67.1% of the value of containerized imports from East Asia and a 57.4% tonnage share. By May, those shares had fallen to 58.9% and 49.9%, respectively, before jumping up again in June to a 67.5% share by value and 59.1% by tonnage.
The dramatic June burst in the USWC share of containerized import tonnage from East Asia came as the nation’s containerized import tonnage from East Asia declined by 3.1% from May to June. By contrast, import tonnage through the two Southern California ports rose by 17.8% from May to June, while the NWSA ports saw an 11.3% bump. Only the Port of Oakland did not share in the month-to-month surge in imports, with its volume of containerized import tonnage from East Asia slipping by 2.2% from that period. (Oakland did see a 10.1% bump in inbound loads from June to July, when the port handled the most inbound loads in any month since June 2022.)