
U.S. West Coast Changing Shares of Containerized Trade
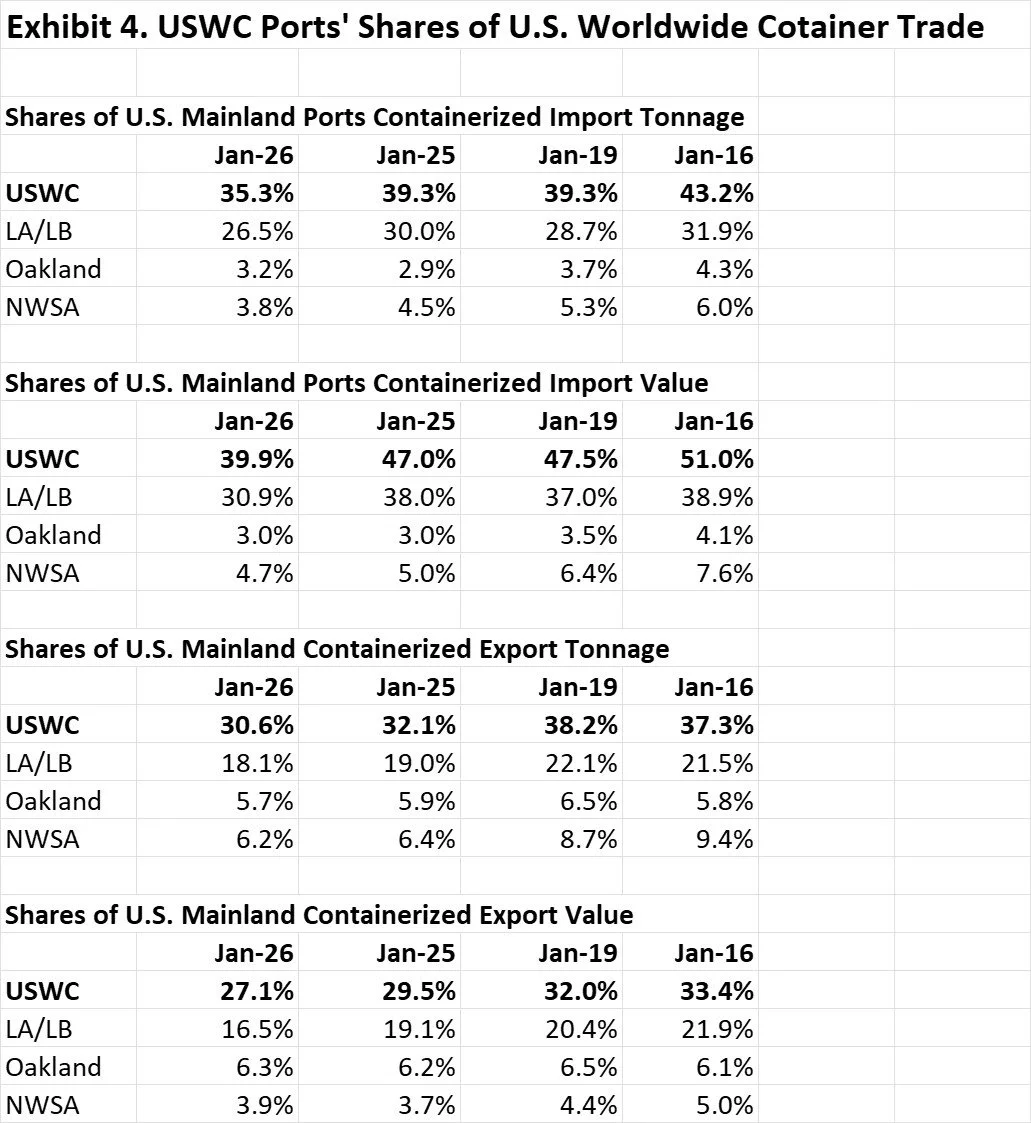
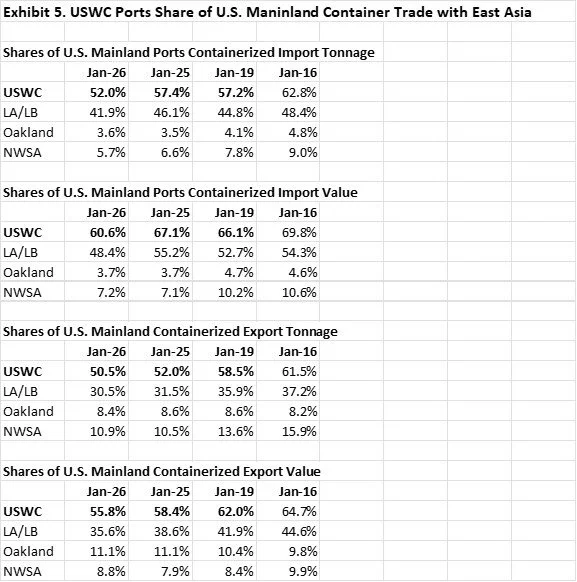
Here we present Exhibit 4 and Exhibit 5 comparing the U.S. West Coast (USWC) ports’ shares of containerized trade through all U.S. Mainland ports in January 2026 (the most recent month for which comparable data are available) with the port’s shares in preceding Januarys. The exhibits display USWC ports’ share for both imports and exports in terms of the declared weight and value of the containers being shipped. Exhibit 4 looks at USWC shares of U.S. containerized trade with all nations, while Exhibit 5 confines itself to containerized trade with the economies of East Asia.
Apart from documenting the declining shares of America’s container trade passing through USWC ports, the data also point to an ongoing consolidation of USWC container traffic at the Ports of Los Angeles and Long Beach.
Which U.S. state handles the most containerized trade?
The answer depends on which metric you choose. In terms of declared tonnage, ports in Texas, chiefly Port Houston, have shipped the most containerized export tonnage since 2023, when it eclipsed California. Georgia came third. Texas’ ports also led the nation in terms of the declared value of containerized exports, a title it has held since 2022, when it again overtook California.
For containerized imports, California ports swamped all other states with tonnage over twice that of runner up Texas, 42,674 million metric tons compared to 20.749 million metric tons. The state of New Jersey placed third. The Golden State’s preeminence in handling imported merchandise was also apparent in terms of the declared dollar value of containerized imports. In 2025, containerized goods imported through California ports were valued at $187.320 billion while imports trafficked through Texas ports were worth a total of $80.060.