
Shifting Currents: Air Freight Surges as Container Trade Reverts to Norms
An Unusual First Quarter Surge in Air Freight
Everyone knows that importers striving to avoid impending tariff increases brought in a passel of products during the first quarter of this year. In every media outlet from print newspapers to gubernatorial podcasts, images depicting seaport operations are used to frame reports about the nation’s foreign trade. That is understandable but occasionally misleading.
To be sure, container shipping has a very imposing physical footprint (big ships, towering gantry cranes, mile-long freight trains, fleets of large trucks hauling steel boxes, millions of square miles of warehouse facilities, and vast armies of workers).
However, what has somehow eluded in the mainstream media is that more of the nation’s $948.096 billion in imports in this year’s first quarter arrived by air than in oceanborne containers.
According to official U.S. import statistics, airborne imports in Q1 totaled $351.538 billion, while seaborne containerized imports were valued at $262.326 billion. Another $216.923 billion arrived, traveling largely overland from Canada and Mexico.
This is a bit unusual. Normally, the value of seaborne container imports exceeds the value of airborne imports. Last year, for example, goods valued at $1.041 trillion arrived in containers at U.S. seaports, while $901.288 billion in merchandise was delivered by air. I have not seen much reporting that airborne imports enjoyed an 81.1% year-over-year surge in Q1, mainly attributable to exceptionally large jumps in shipments from Ireland, Switzerland, and Taiwan.
The 2025 Reversion of Container Traffic to Pre-Strike Threat Norms
The settlement of the contract dispute between the International Longshoremen’s Association and the U.S. Maritime Alliance has had the predictable effect of returning U.S. container trade flows to the coastal distribution patterns that preceded the threat of a strike that would have shuttered East and Gulf Coast ports.
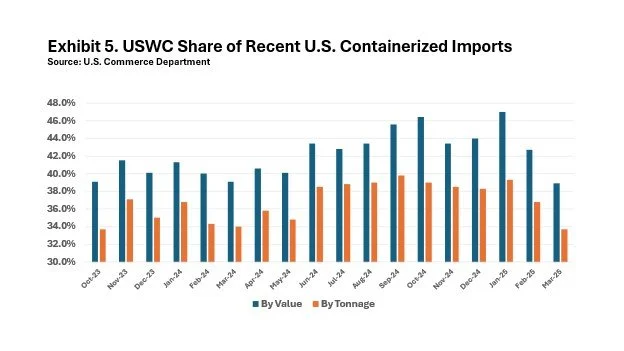
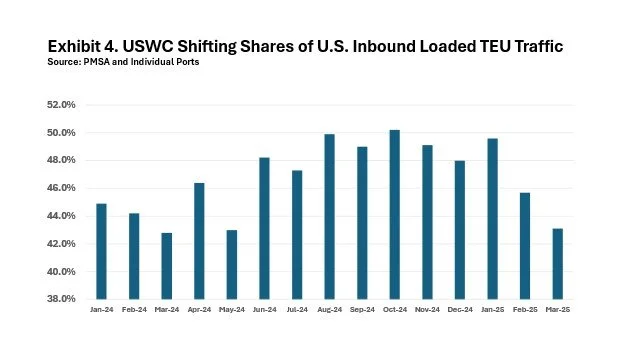
Exhibit 4 attests to the roller-coaster ride that USWC ports’ shares of inbound loaded TEU traffic at U.S. ports have experienced since early last year as shippers and shipping lines engaged in a real-time exercise in risk management that caused more of the nation’s container trade to migrate to USWC ports before starting to flow back following a contract settlement in January.
The shift displayed in Exhibit 4 is mirrored in Exhibit 5 and Exhibit 6 which show that the U.S. West Coast share of all U.S. inbound container traffic as measured in tonnage and value terms has fallen substantially this year after rising early last summer as the previous contract’s expiration date grew nearer. In January, USWC ports held a 47.0% share of the value of containerized imports and a 39.3% share of containerized import tonnage. By this March, those shares had declined to 38.9% and 33.7%, respectively.
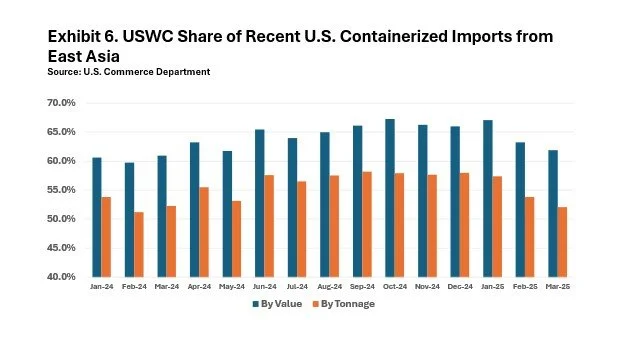
The loss of share has been especially dramatic with respect to inbound container traffic originating in East Asia, as Exhibit 6 reveals. In January, USWC ports handled 67.1% of the value of containerized imports from East Asia and a 57.4% tonnage share. By March, those shares had slipped to 61.9% and 52.1%, respectively.