
Search our collection of articles, blogs, resources and more to stay informed on the goods movement sector.

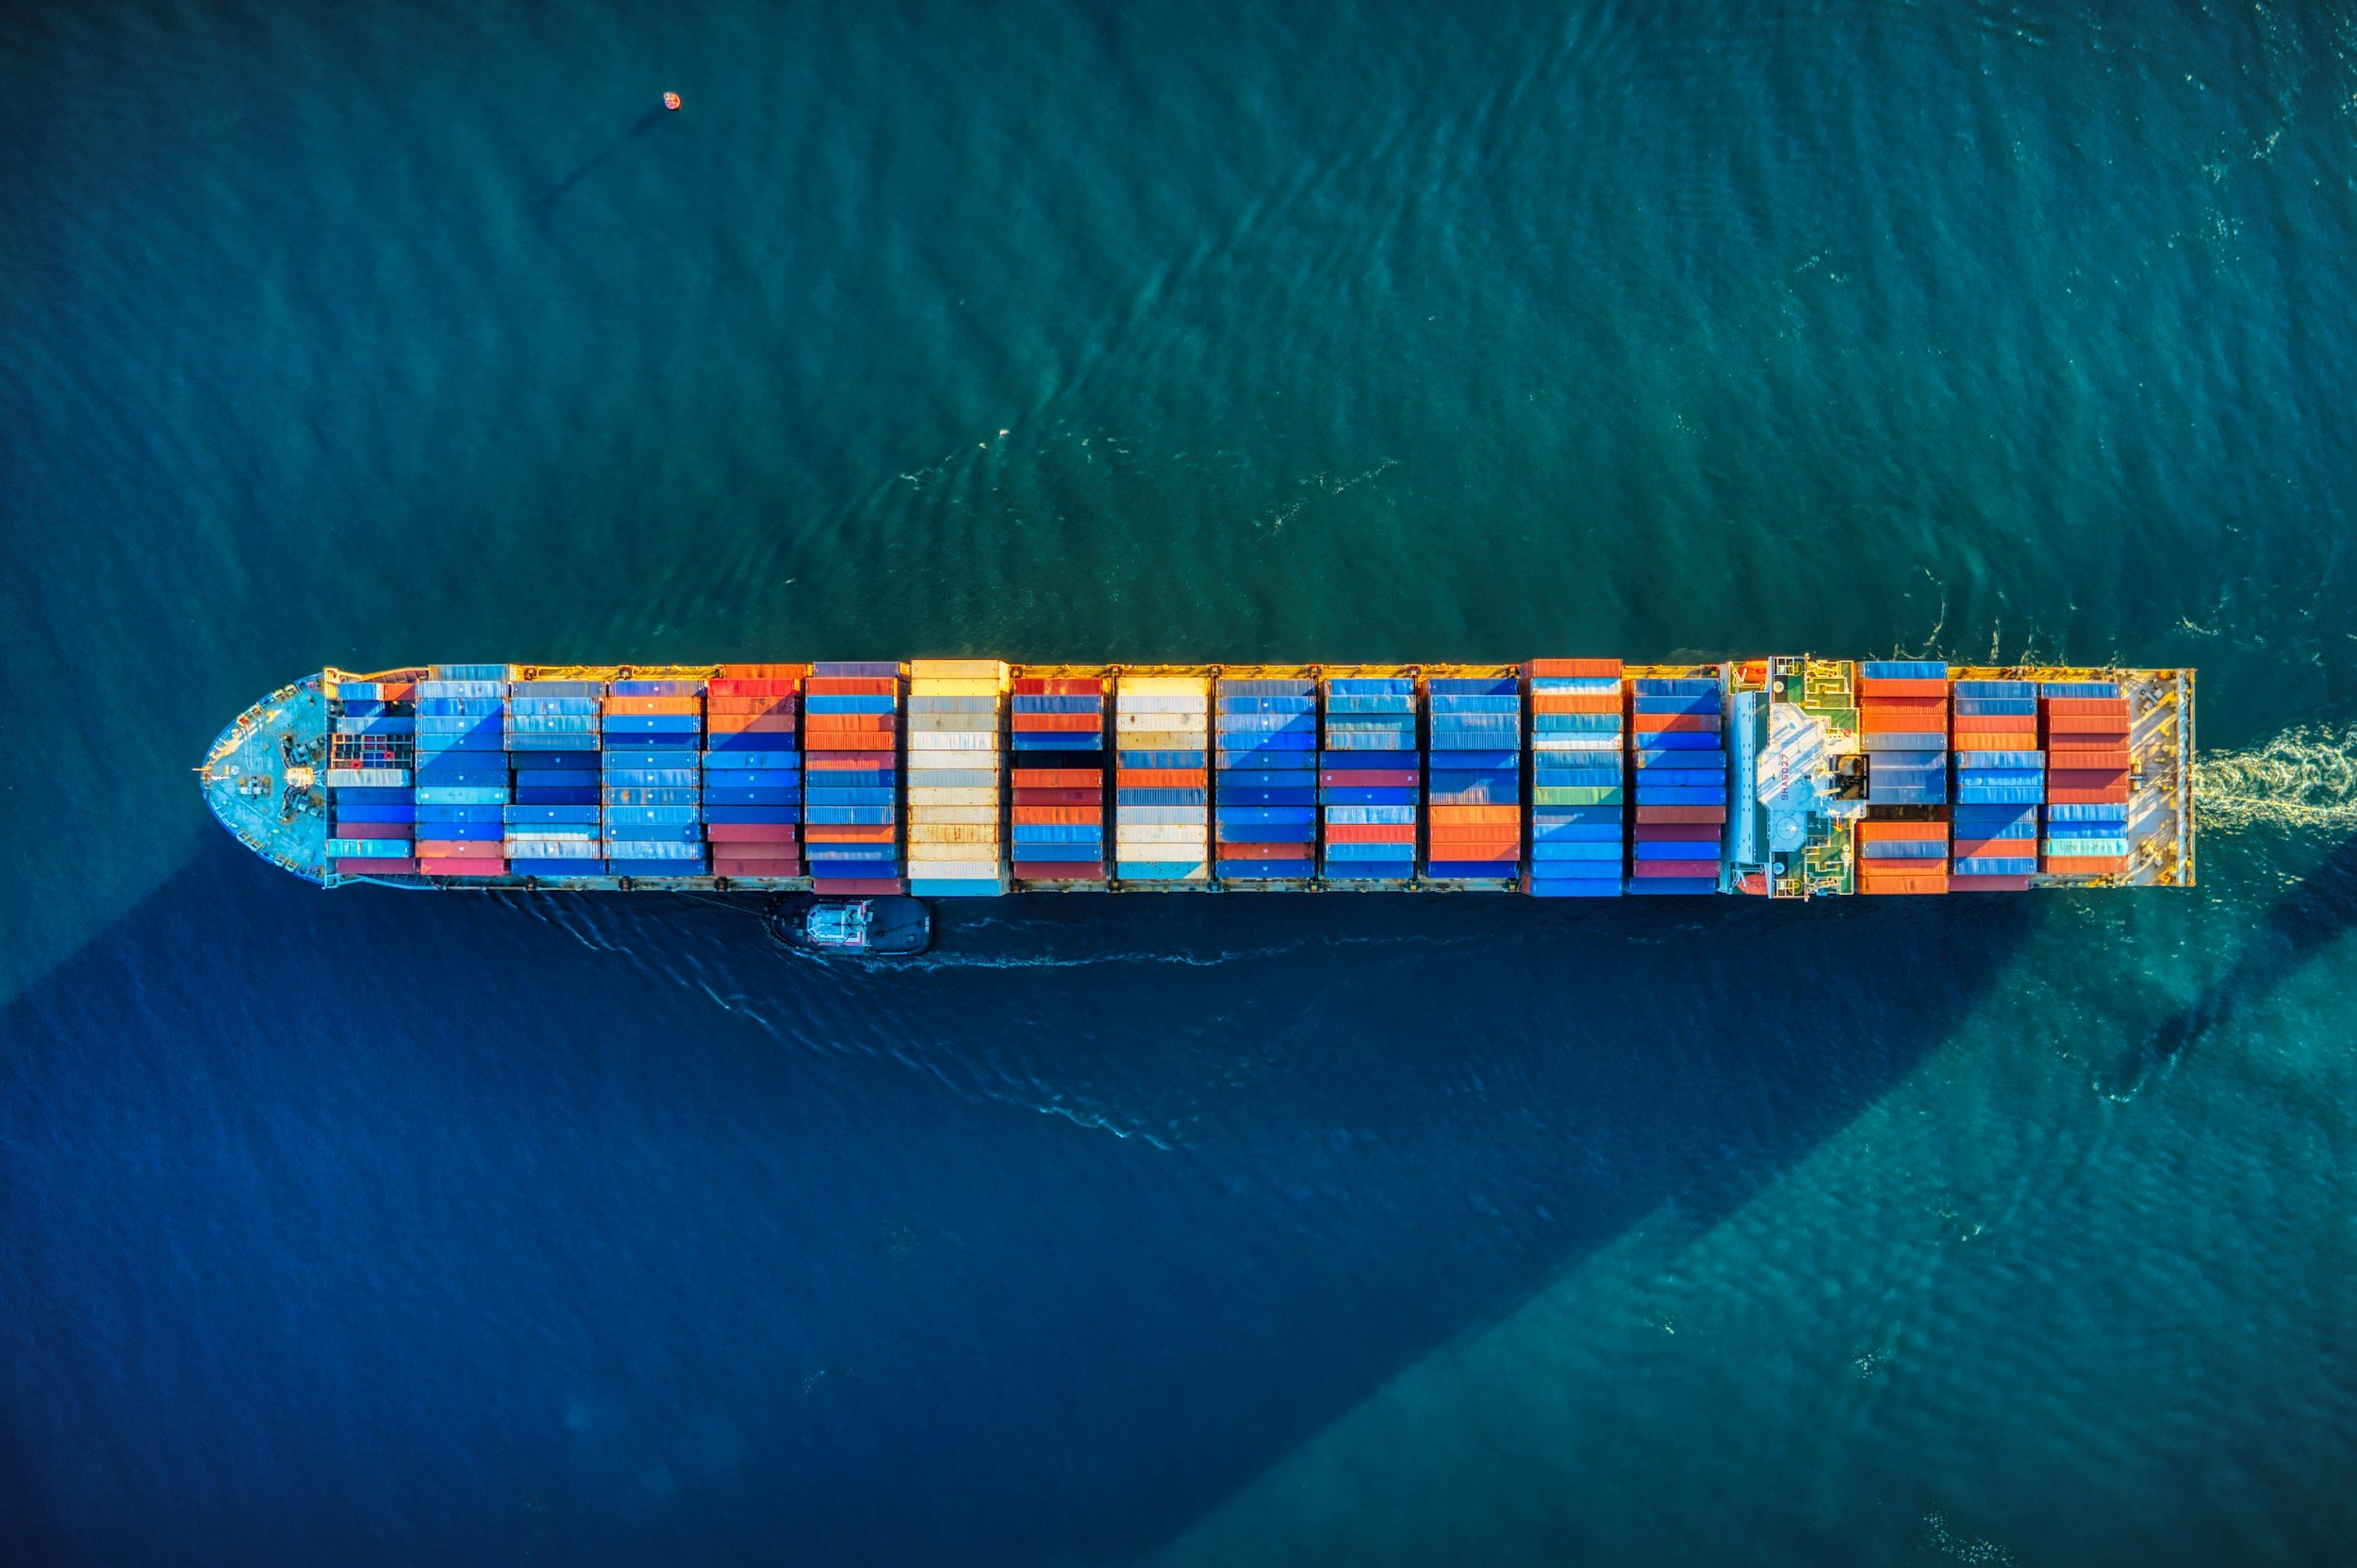
U.S. Soybean Seaborne Exports
With China halting U.S. soybean imports, shipments to alternate buyers like Egypt, Germany, Indonesia, and Japan are rising—but not enough to fully compensate. Explore export trends, port flows, and market impacts in this deep dive

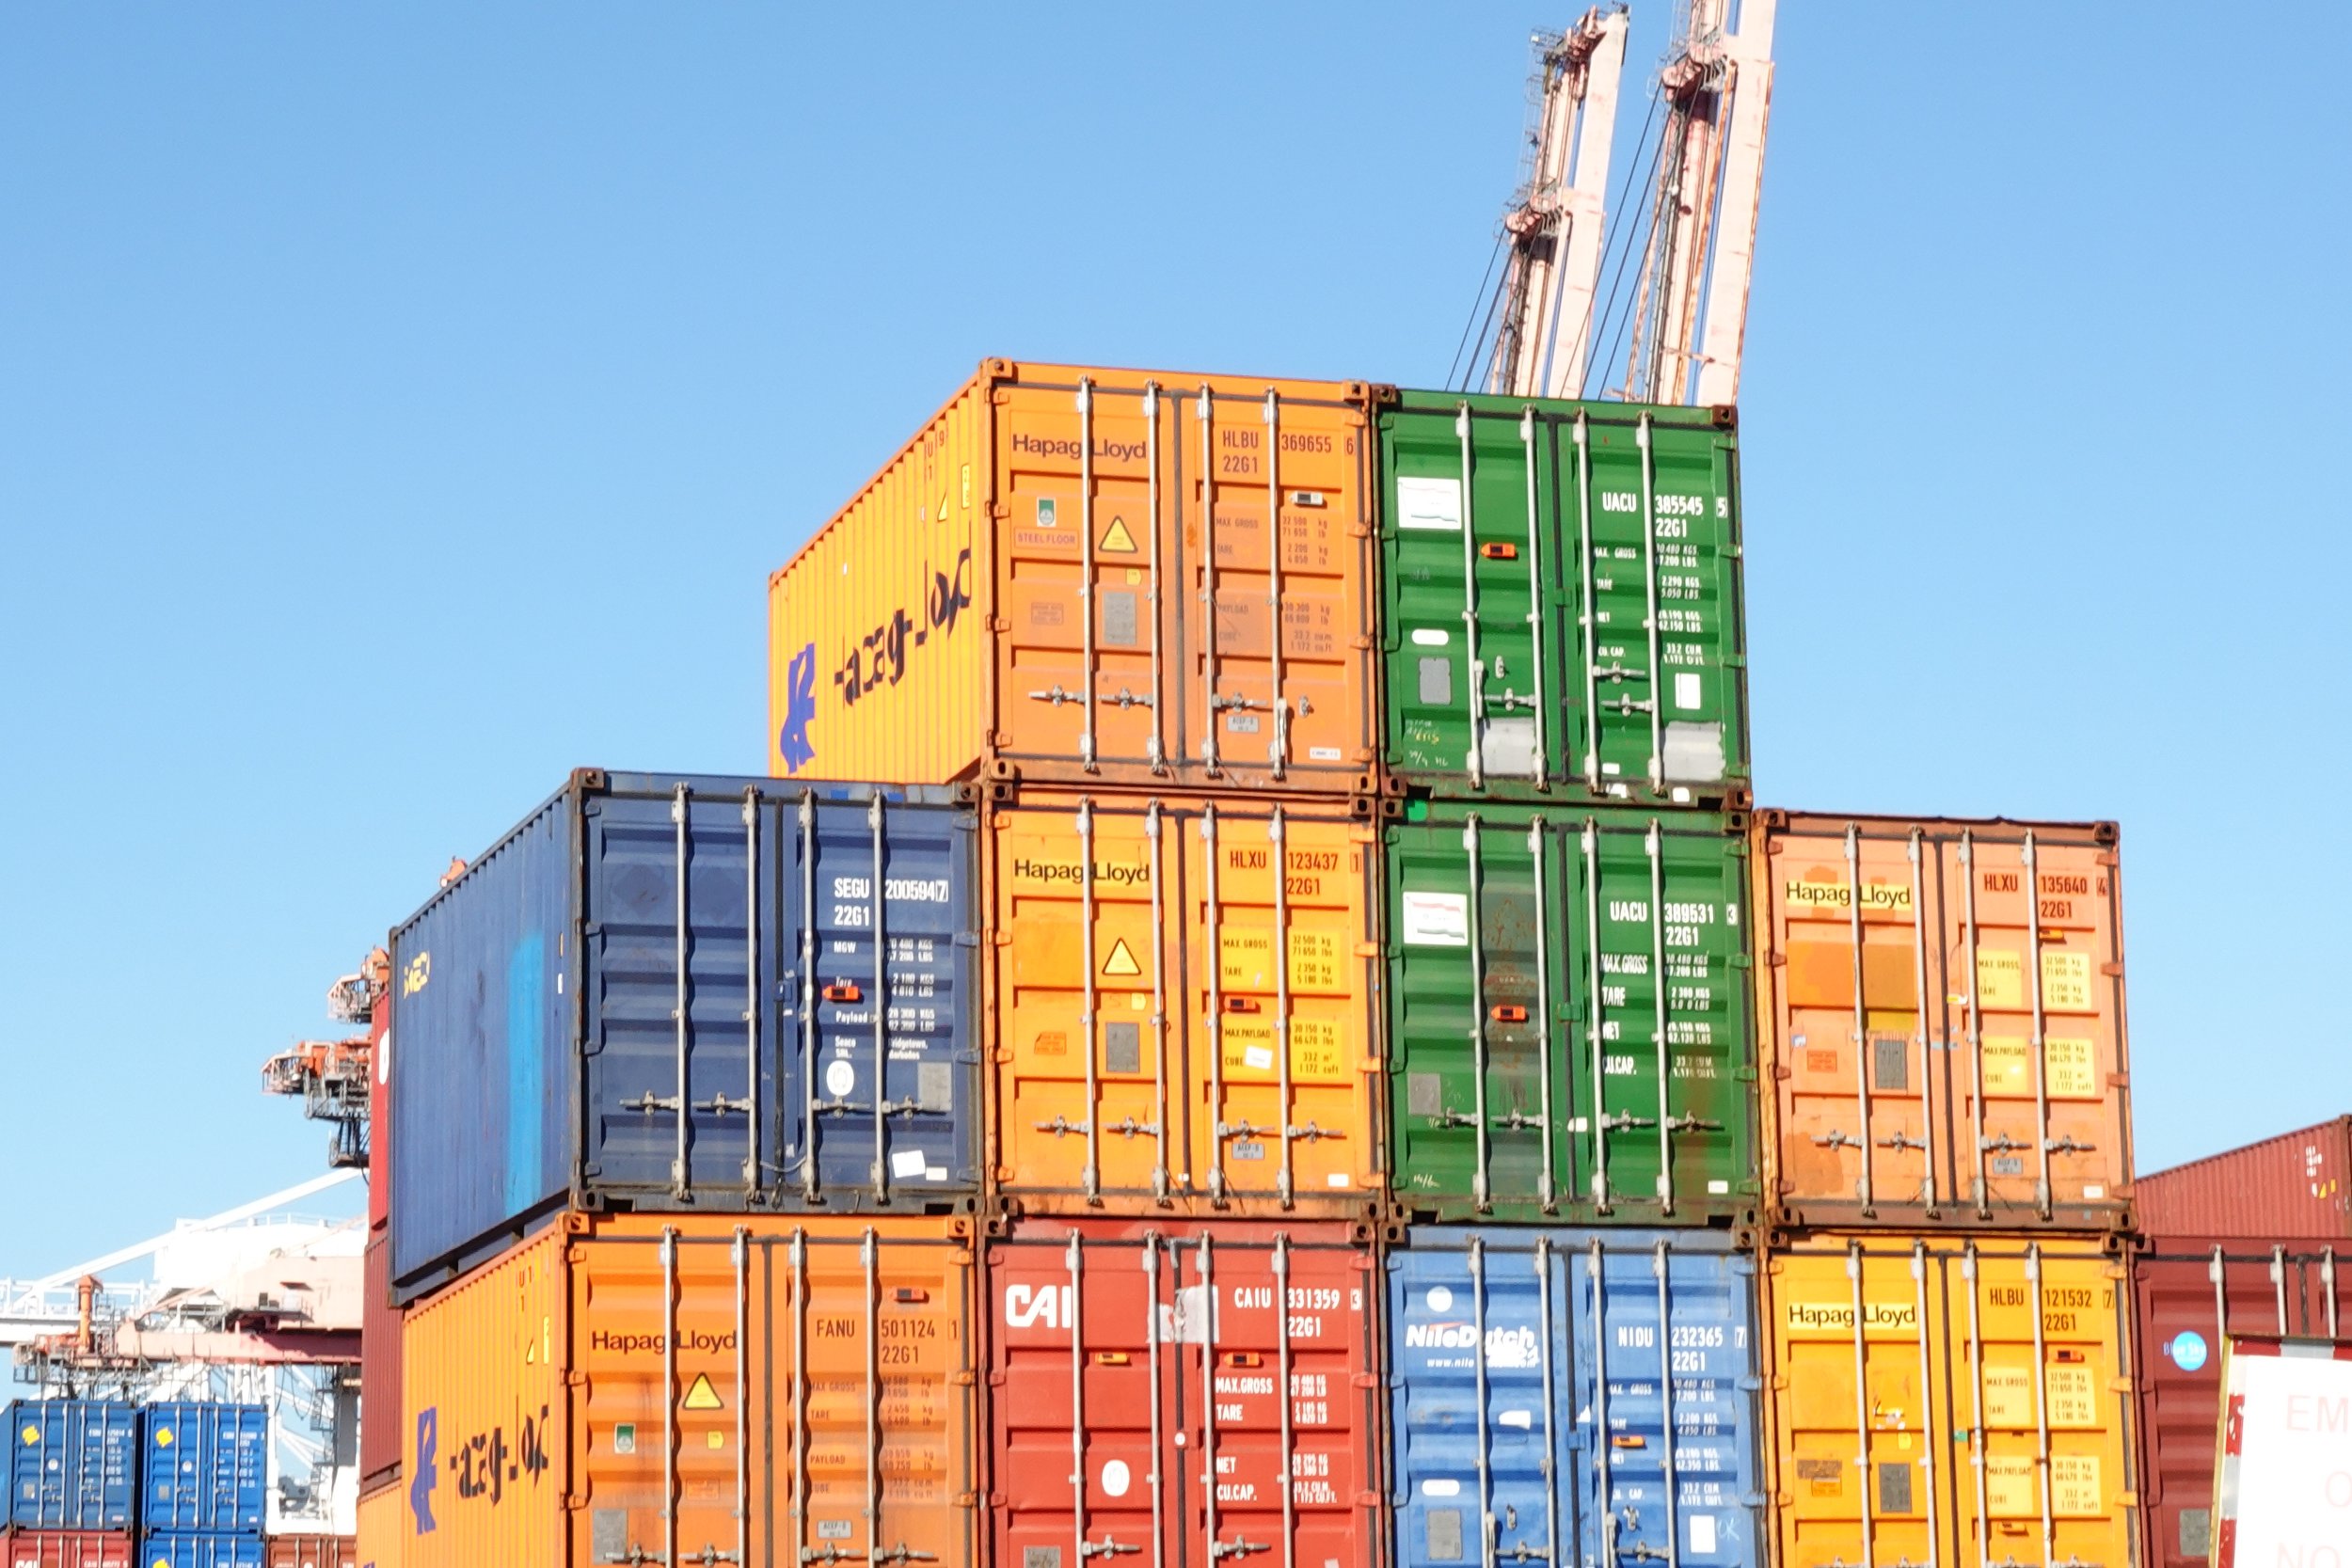
Diverting California’s Tree Nut Exports
California’s almond, walnut, and pistachio exporters are redirecting more cargo through Southern California ports and Houston, reducing Oakland’s historic share. Learn why logistics, rail links, and market dynamics are driving this shift in U.S. agricultural export flows.

August 2025 TEUs
In August 2025, the Ports of Los Angeles and Long Beach handled nearly 945,000 inbound loaded TEUs—down 2.2% year-over-year but up 24.3% vs. 2019. Get a full breakdown of U.S. port volumes, inbound/outbound trends, and YTD comparisons in our latest data release.
San Pedro Bay Ports Container Dwell Times for September 2025
In September 2025, San Pedro Bay ports maintained efficient operations with truck dwell times averaging 2.75 days and rail dwell times at 3.98 days.

PMSA Statement Regarding Air District Decision to Move Forward on Cooperative Alternative to Seaport Regulations
The Pacific Merchant Shipping Association (PMSA) applauds the South Coast Air Quality Management District (SCAQMD) for moving forward with a Cooperative Agreement alongside the Ports and Cities of Los Angeles and Long Beach. This collaborative approach replaces the previously proposed Indirect Source Rule (ISR), aiming for enhanced emissions reductions through voluntary, consensus-driven efforts. PMSA highlights the success of this model in achieving significant air quality improvements without resorting to burdensome regulations.

Historic U.S. West Coast Container Traffic by Weights and Values
In July 2025, U.S. West Coast ports accounted for 37.2% of U.S. containerized import tonnage, with the Ports of Los Angeles and Long Beach capturing 28.8% of the share. This marks a slight year-over-year decline from 37.8% in July 2024. Notably, the LA/LB ports increased their share of containerized import tonnage from East Asia by 1.3 percentage points, reflecting their continued dominance in trans-Pacific trade.


San Pedro Bay Ports Container Dwell Times for August 2025
Track August 2025 container dwell times at the Ports of Los Angeles and Long Beach. Local truck dwell averaged 2.73 days and rail dwell improved to 4.98 days, reflecting efficient cargo flow and strong supply chain coordination at the nation’s busiest port complex.

June 2025 TEUs
June 2025 TEU data reveals key shifts in U.S., Canadian & Mexican port volumes, West Coast shares, and global container trade trends.

San Pedro Bay Ports Container Dwell Times for July 2025
July 2025 dwell times at the Ports of Los Angeles & Long Beach stay efficient — truck dwell ~ 2.87 days, rail ~ 5.18 days — despite record-breaking cargo volumes.

May 2025 TEU
Exhibits 1-3 display the May TEU counts for the North American ports PMSA monitors. (Note that May figures for the Port of Baltimore were unavailable by our publication deadline.) At the remaining U.S. ports, the year’s fifth month saw the number of inbound loaded TEUs decline by 6.4% from a year earlier to 2,018,951 TEUs as confusion over tariffs prompted importers to slow the build-up of inventory.

San Pedro Bay Ports Container Dwell Times for June 2025
Explore June 2025 dwell time data for the San Pedro Bay ports. Learn how improved rail and truck cargo movement at the Ports of LA and Long Beach reflects continued operational efficiency.

April 2025 TEUs
April 2025 container data reveals shifting trends at North American ports, with West Coast gateways seeing modest growth and Gulf ports continuing to outperform. Explore key TEU stats and trade insights.

San Pedro Bay Ports Container Dwell Times for May 2025
May 2025 dwell times at the Ports of Los Angeles and Long Beach held steady, with rail cargo averaging 4.70 days and truck cargo just under 3. Learn how consistent terminal operations are supporting resilient supply chains amid global trade uncertainty.

March 2025 TEUs
At the U.S. ports we track, the year’s third month saw the number of inbound loaded TEUs increase 11.6% from a year earlier to 2,276,719 TEUs as the prospect of higher tariffs spurred importers to load up on inventory. Collectively, outbound loads from those same U.S. ports edged up by 3.6% from March 2024 to 1,123,083 TEUs.

San Pedro Bay Ports Container Dwell Times for April 2025
Dwell times at the San Pedro Bay Ports improved in April 2025, with rail-destined cargo averaging 4.72 days - the lowest since April 2024. Truck-bound containers remained stable at 2.78 days for the twelfth consecutive month. This consistency reflects continued coordination and efficiency across the supply chain, even amid shifting trade volumes.