
Search our collection of articles, blogs, resources and more to stay informed on the goods movement sector.

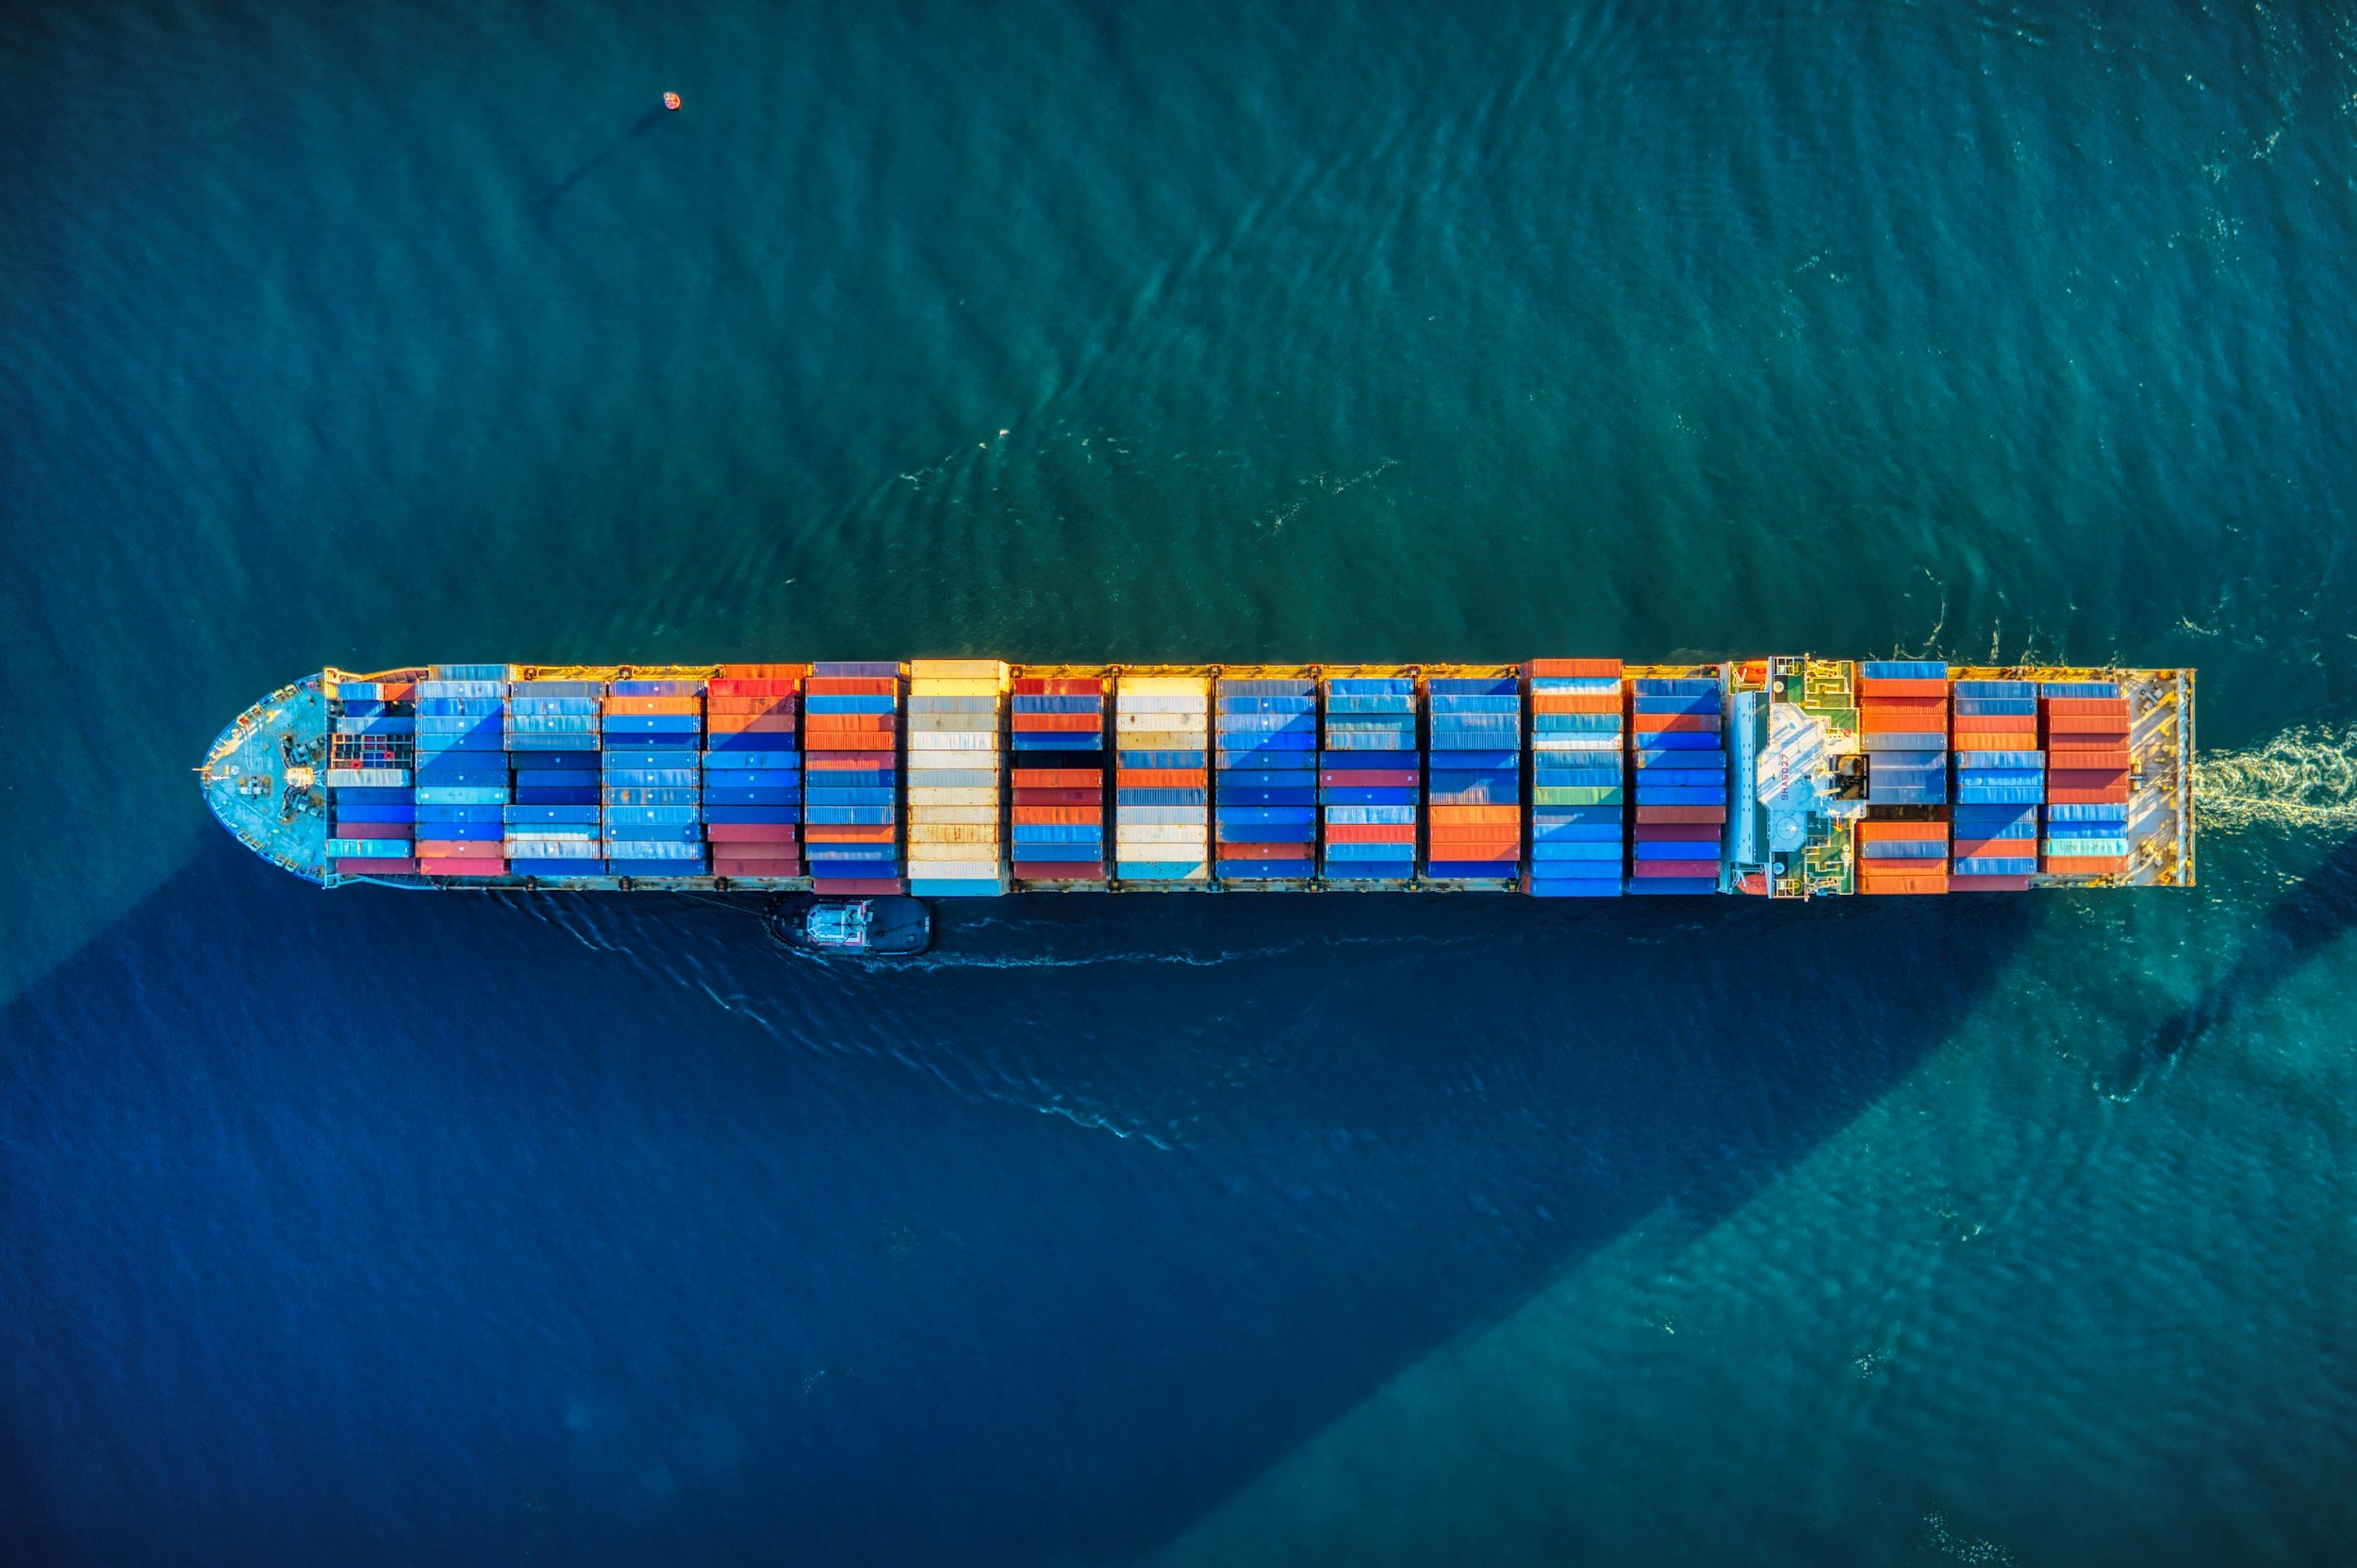
The Lumpy USWC Share of Recent U.S. Container Trade
West Coast ports see volatile market share in U.S. container trade as tariffs, labor risks, and East Asia imports drive shifting cargo flows.

San Pedro Bay Ports Container Dwell Times for July 2025
July 2025 dwell times at the Ports of Los Angeles & Long Beach stay efficient — truck dwell ~ 2.87 days, rail ~ 5.18 days — despite record-breaking cargo volumes.

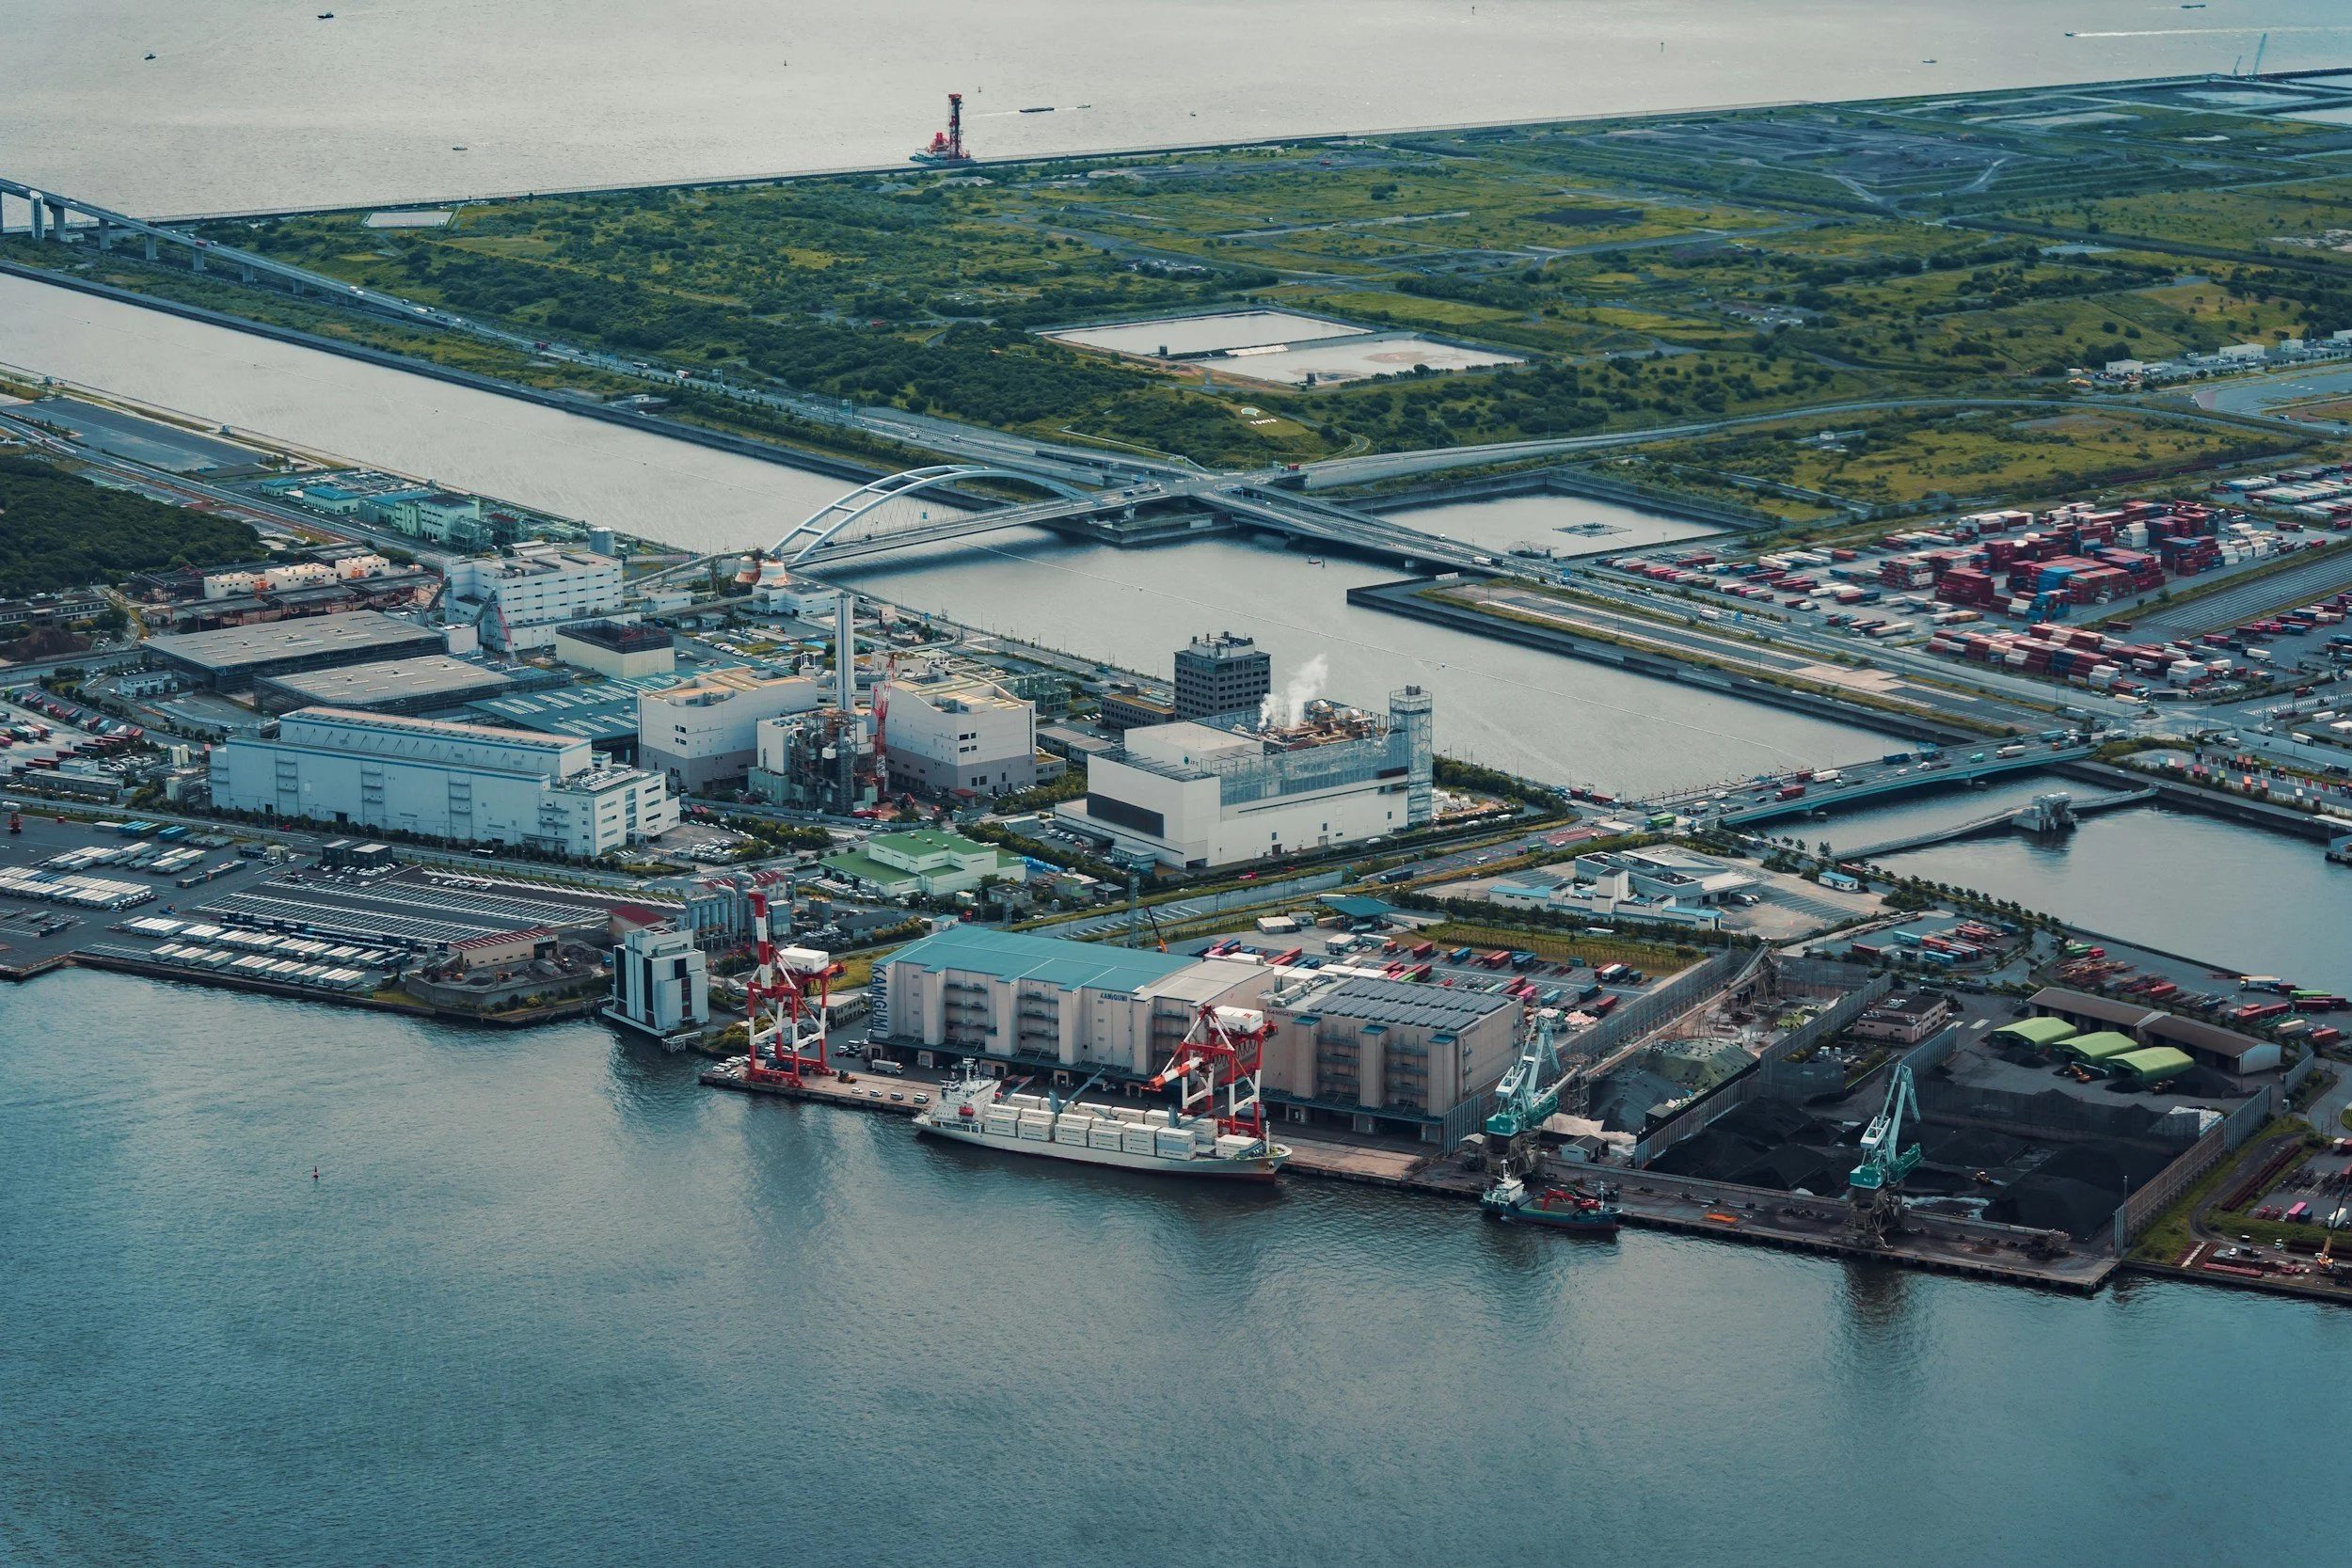
Port Indirect Source Rule Newsletter #14
SCAQMD delays Ports ISR rulemaking for 45 days as Ports LA & LB push for a voluntary, collaborative path to cleaner air—45-day negotiation window ends Sept 18.

PMSA Supports Southern California Air District Decision to Work with Cities and Ports of Los Angeles and Long Beach on Cooperative Air Plan
PMSA supports SCAQMD’s 45-day pause on Port ISR rulemaking, backing a voluntary, cooperative emissions reduction agreement with LA and Long Beach ports.

The Mistakes of the Past, the Opportunities of the Future
Thomas Jelenić, Vice President of PMSA
Southern California regulators are about to repeat the environmental policy mistakes California has made on grand scale. For decades, California was a leader in reducing pollution from mobile sources. It is important to stress the word “leader” here.

Who’s Number One?
Normally, the Port of Los Angeles is the nation’s busiest container gateway. Still, from time to time, the Port of New York/New Jersey (PNYNJ) lays claim to the title, invariably causing the East Coast media to break out the celebratory sparklers. The contest for the nation’s top container port is typically framed in the media as a rivalry between PNYNJ and the Port of LA, the Yankees vs. the Dodgers, if you will.

Preliminary June 2025 TEUs
On July 9, the National Retail Federation’s Global Port Tracker projected that 2.06 million TEUs laden with goods from abroad would arrive in June at the thirteen U.S. mainland ports it surveys.

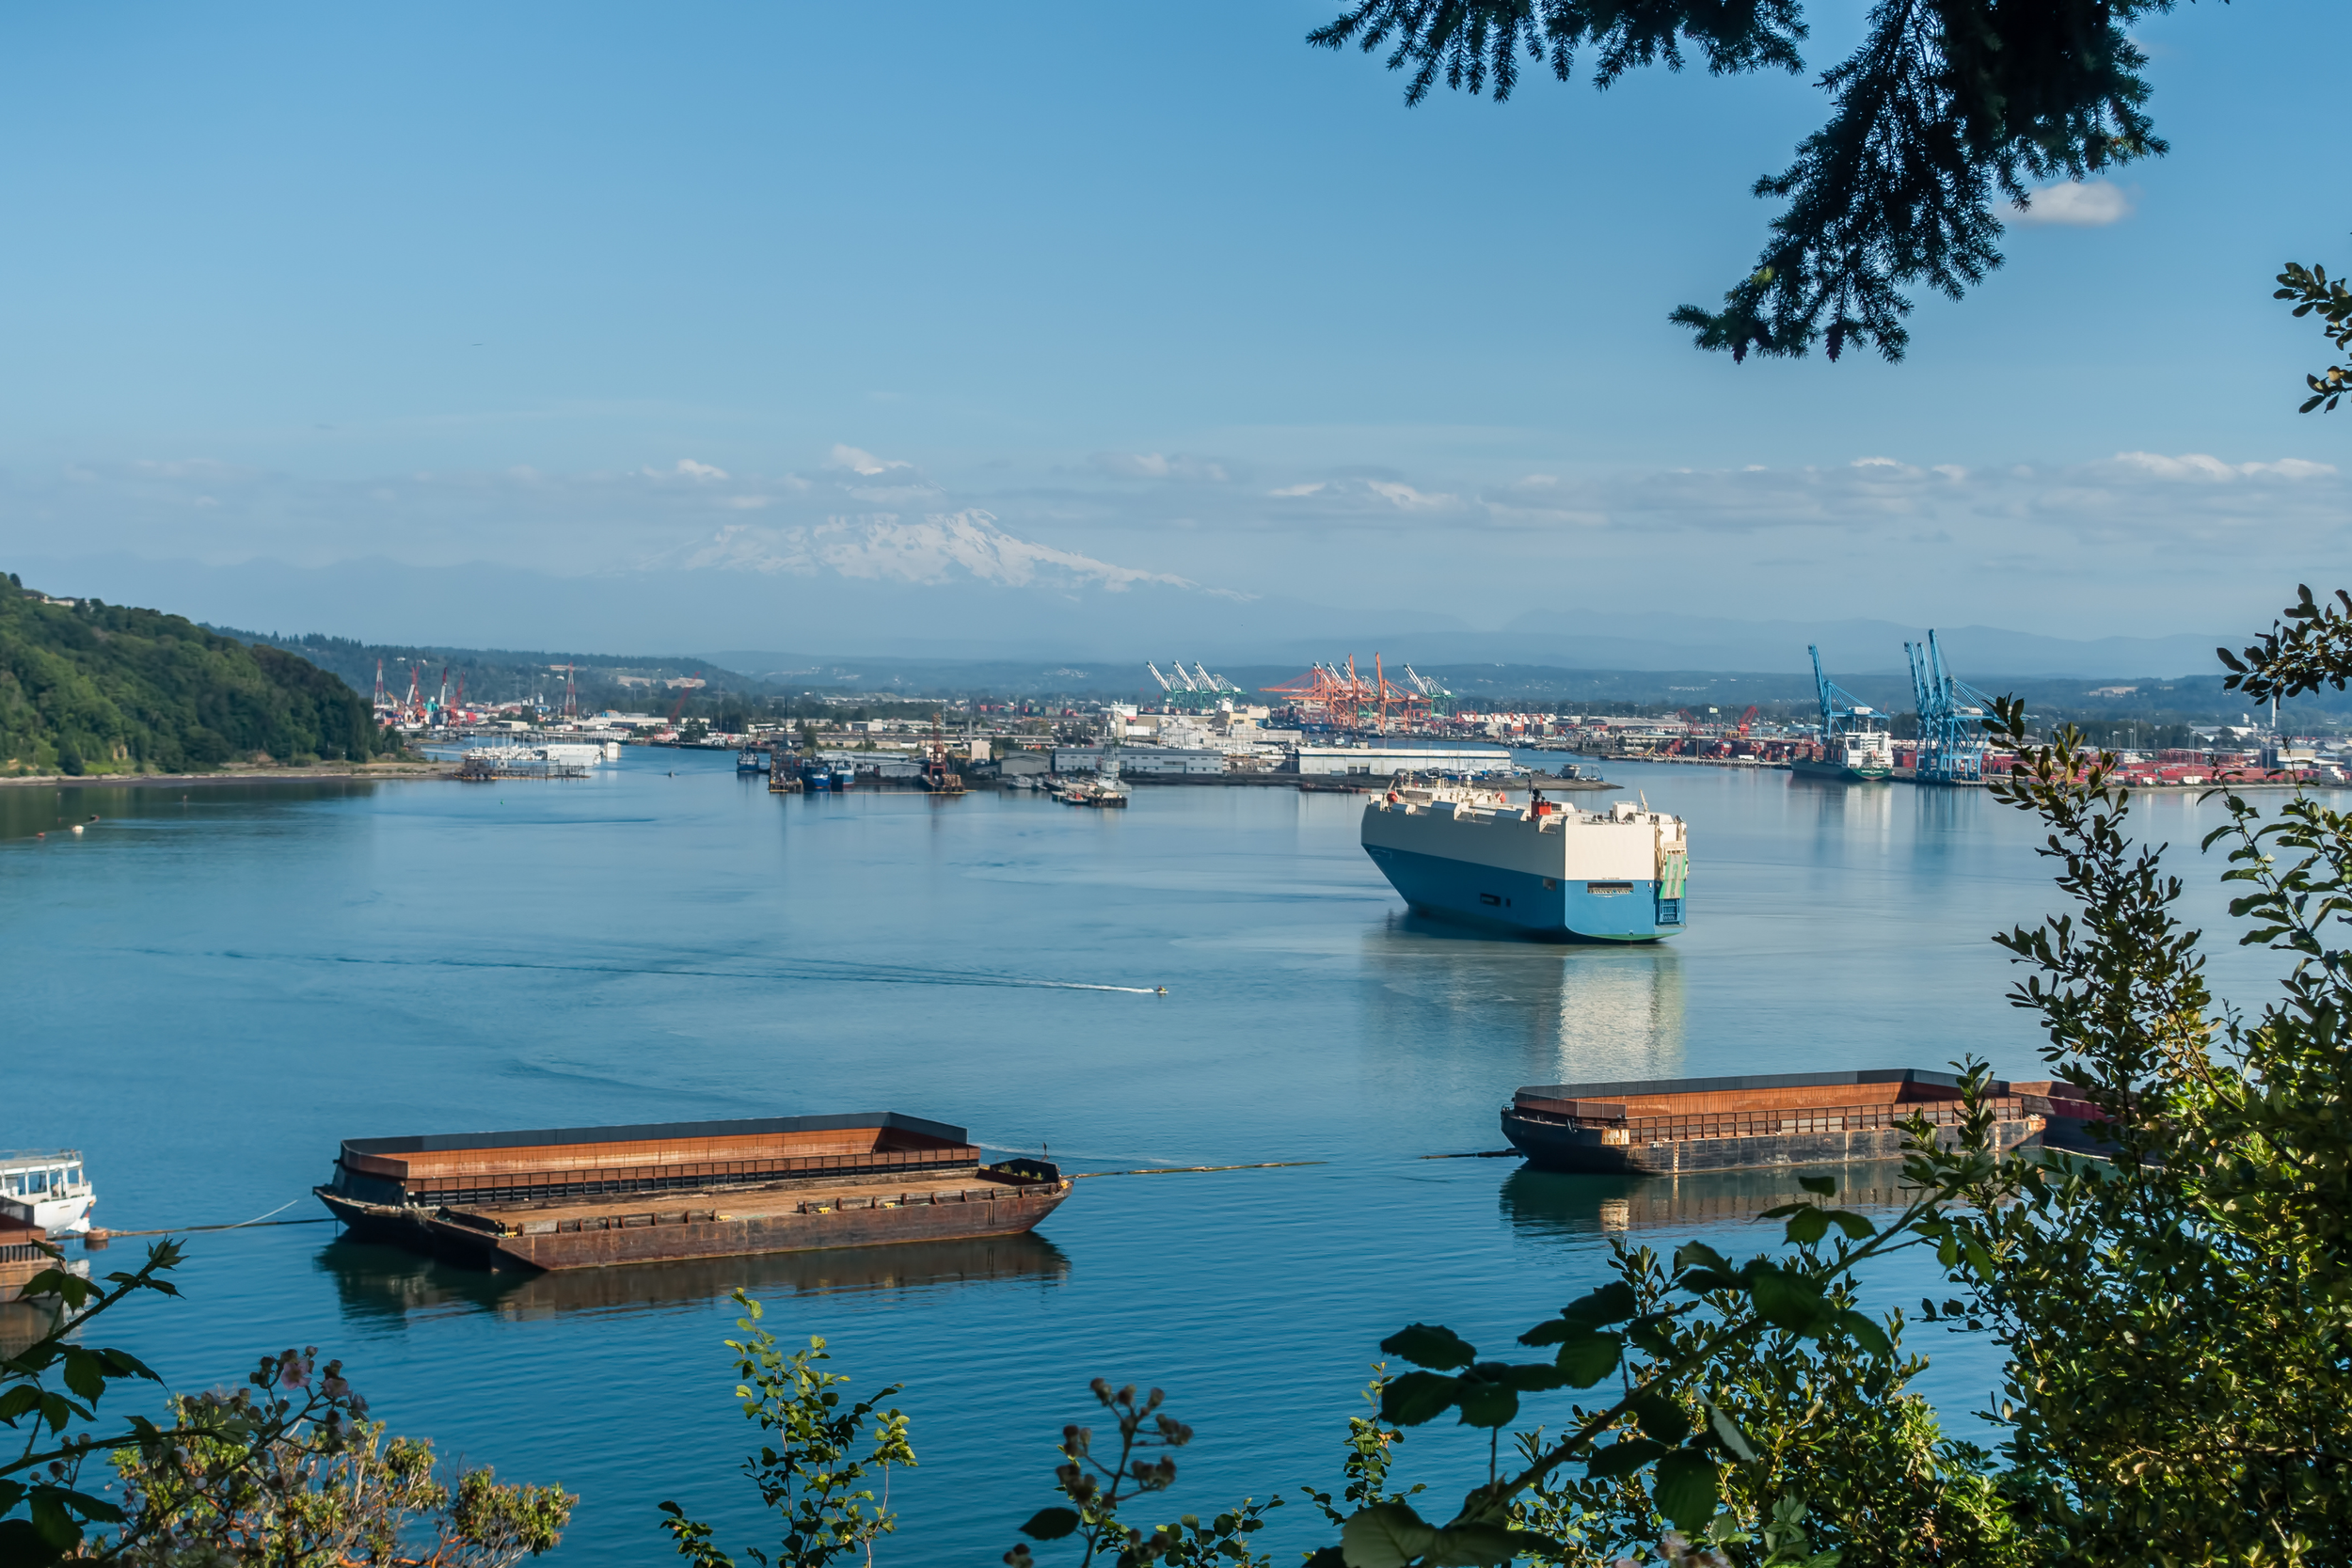
Seattle and Tacoma Seaports Drive the Pacific Northwest Economy
John Wolfe, CEO for the Northwest Seaport Alliance
Recently the Ports of Seattle and Tacoma and the Northwest Seaport Alliance released a first of its kind collaborative effort to measure the statewide economic impact of our Puget Sound ports. From the airport, to our marine cargo gateway, from the fishing fleets to the ecosystem of industrial lands that support all our port’s activities, these ports have a regional to global impact.
Is the USWC Marketshare of U.S. Container Trade Winding Down?
Explore whether the U.S. West Coast’s share of container trade is declining, examining recent trends, stats, and implications for port competition.
The USWC’s Diminishing China Export Trade
Through the first five months of 2025, containerized export tonnage from U.S. West Coast ports to China and Hong Kong plunged by 42.1% from the same period a year earlier and by 61.4% from the same months in 2019.
Ship Traffic Trends Amidst Trade Uncertainty
Captain Mike Moore, Vice President of PMSA
Ports often assess performance by tracking cargo volume growth. While additional metrics exist, cargo reigns supreme. Container ports measure activity in terms of twenty-foot equivalent units (TEUs), categorized by imports, exports, and empties in both domestic and international trade.
Japan’s Container Trade with the Ports of Tacoma and Seattle
Once upon a time, Japan was the primary overseas trading partner of the ports that now operate as the Northwest Seaport Alliance. Indeed, Japan was the leading U.S. trading partner for containerized cargo, according to a 1980 report from the U.S. Maritime Administration.

To Reduce or Not to Reduce Emissions? That is the Question
Jennifer Cohen, PMSA Vice President, Government Relations
PMSA has sponsored a bill for the past several years in the California state legislature to facilitate testing and piloting, at 100% private expense, of cargo handling equipment (CHE) technology that eliminates tailpipe greenhouse gas and diesel particulate matter emissions, and nearly eliminates nitrogen oxide emissions.

May 2025 TEU
Exhibits 1-3 display the May TEU counts for the North American ports PMSA monitors. (Note that May figures for the Port of Baltimore were unavailable by our publication deadline.) At the remaining U.S. ports, the year’s fifth month saw the number of inbound loaded TEUs decline by 6.4% from a year earlier to 2,018,951 TEUs as confusion over tariffs prompted importers to slow the build-up of inventory.

San Pedro Bay Ports Container Dwell Times for June 2025
Explore June 2025 dwell time data for the San Pedro Bay ports. Learn how improved rail and truck cargo movement at the Ports of LA and Long Beach reflects continued operational efficiency.

A Tax on Trade: The Hidden Costs of the Port ISR
Mike Jacob, President
Examine how the South Coast Air Board’s proposed rule 2304 (ISR) acts as an indirect tax on consumers. This article analyzes regulation impacts, economic implications, and what maritime and logistics sectors need to know.

Preliminary May 2025 TEUs
Discover the latest preliminary container volumes for May 2025, revealing emerging shifts in port trade dynamics. This update highlights trends across major West Coast, East Coast, Gulf, and Canadian ports, offering a snapshot of loaded and empty TEU activity.

America's Favorite Fruit: The Banana's Journey to Your Grocery Aisle
Trace the journey of America’s favorite fruit—from tropical plantations to supermarket shelves. This article delves into banana production, shipping logistics, and trade dynamics shaping the fruit’s path to your grocery cart.

West Coast Tree Nut Export Trade
Explore West Coast tree nut exports in this data-rich analysis. From almonds and pistachios to walnuts, discover port-specific volumes, top global destinations, and how tariffs and logistics shape California’s vital agricultural trade.

Revisiting the Numbers on Reversions to Historic Norms
Dive into a data-driven analysis of how container trade is reverting to long-term patterns. This article examines historical norms, trends in empty vs. laden TEUs, and what these shifts reveal about global trade stability and U.S. export competitiveness.