Search our collection of articles, blogs, resources and more to stay informed on the goods movement sector.
Maritime Industry Successfully Protects Whales Through Voluntary Partnerships
Learn how the maritime industry is protecting endangered whales through voluntary vessel speed reduction partnerships that have reduced ship-strike risks, cut harmful emissions, and strengthened collaboration among carriers, regulators, and California environmental programs.
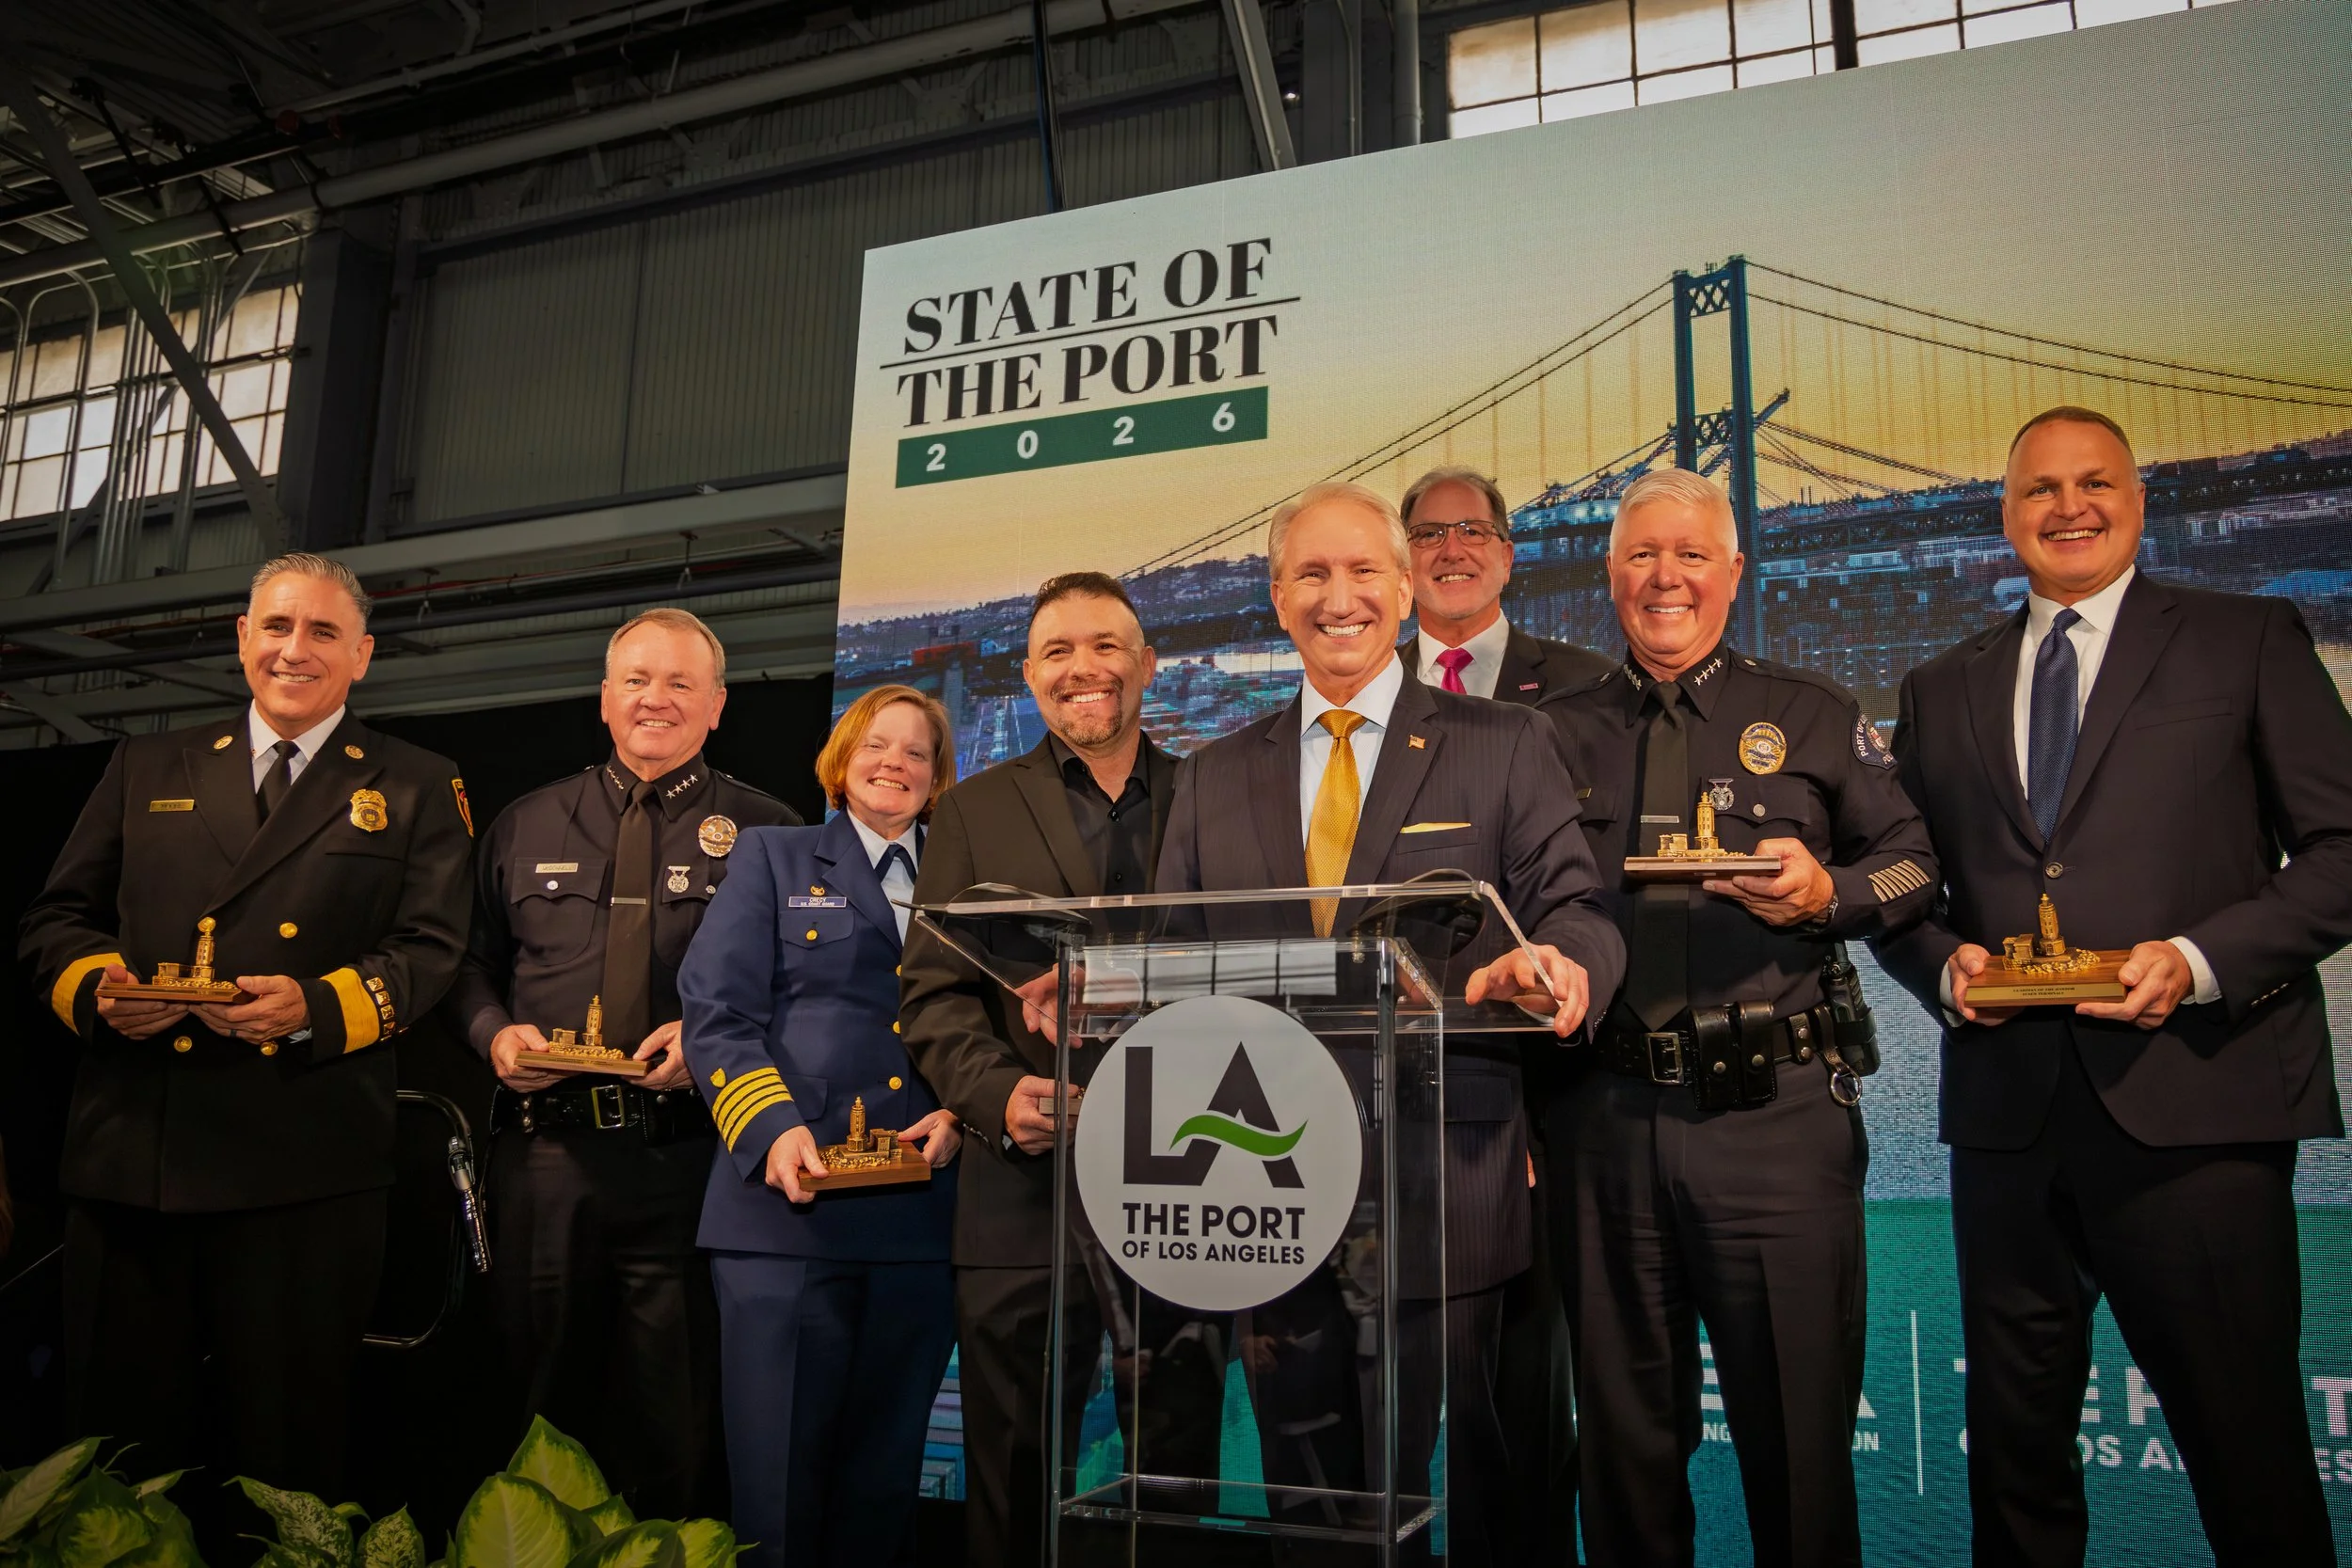
Port of Los Angeles Charts Path for Growth at 11th Annual State of the Port with Record-Breaking Attendance
Discover how the Port of Los Angeles set a record with more than 920 attendees at the 11th Annual State of the Port event, where industry leaders gathered to discuss robust 2025 cargo performance, major growth strategies, sustainability initiatives, and future infrastructure investments to strengthen America’s busiest seaport.
Record Volumes, Efficiency Gains, and Environmental Apex Amidst the Chaos: Los Angeles and Long Beach Seaports Close Out 2025 with Historic Achievement
Explore how the Ports of Los Angeles and Long Beach closed out 2025 with historic achievements—record cargo volumes, operational efficiency gains, and leading environmental performance across the nation’s busiest seaport complex despite market volatility and trade uncertainty.
USWC Historic Shares of U.S. Containerized Trade
Analyze the latest U.S. West Coast container trade data showing how the Ports of Los Angeles and Long Beach, while still consolidating Pacific trade, saw shifts in their share of national containerized import and export tonnage through October 2025 amid broader coastal market dynamics and China trade turbulence.
Collapsing EV Exports & Thank Heavens for Scrap Paper
Unpack the latest maritime data in “Thank Heavens for Scrap Paper,” exploring collapsing electric vehicle export volumes, shifts in containerized freight patterns, and how scrap paper tonnage trends are reshaping port traffic and supply chain dynamics in early 2026.
The Declining China Trade
Explore how containerized trade between the U.S. and China has steadily declined over the past decade—dropping China’s share of inbound and outbound tonnage at major U.S. West Coast ports—and what this shift reveals about tariffs, supply chains, and evolving global trade patterns.
December 2025 Container Traffic at North American Ports
Get the latest data on December 2025 container traffic across North American seaports, including TEU volumes at major gateways like Los Angeles, Long Beach, Oakland, Vancouver, and Prince Rupert, year-over-year trends, and insights into annual totals and regional performance.
San Pedro Bay Ports Container Dwell Times for December 2025
Get insights into container dwell times at the San Pedro Bay port complex in December 2025, highlighting average truck and rail cargo movement, year-over-year improvements, and ongoing operational efficiency across the Ports of Los Angeles and Long Beach.
California’s Trade Landscape Is Shifting, Not Shrinking—So Far
By Daniel Parayes-Montoya, Public Policy Institute of California
Understand how California’s international trade is evolving in 2025 despite tariff-driven uncertainty—with steady import/export totals, shifting partnerships (Mexico overtaking China), and varied sector trends shaping the Golden State’s trade outlook.
November 2025 TEUs
Dive into comprehensive November 2025 container traffic statistics across North America’s major ports—including the Ports of Los Angeles, Long Beach, Oakland, New York/New Jersey and others—with year-over-year TEU trends, regional volume shifts, and broader trade patterns shaping the end of the year.
The November TEU Tallies Ports Are Actually Reporting
Explore the actual November TEU tallies reported by major North American ports, revealing variations in container volume performance, year-over-year comparisons, and how key gateways are navigating evolving trade conditions in late 2025.
California’s Inland Waterways
Learn how California’s inland waterways—critical channels connecting the Sacramento and Stockton deep-water ports to the Pacific—face infrastructure challenges like severe shoaling, aging bridges, and insufficient dredging funding that threaten navigation, ag-export flows and foreign trade worth millions annually.
Are 2025’s Shocks to the Intermodal System Cementing the Pandemic-Era Divergence in Fortunes At US West Coast Ports?
By Mike Jacob, President, Pacific Merchant Shipping Association
Examine how 2025’s intermodal system shocks—rail bottlenecks, shifting carriage patterns, and coast-to-coast network constraints—may be reinforcing the pandemic-era divergence in volume and efficiency between U.S. West Coast ports and their inland/Atlantic counterparts. (pmsaship.com)
Peak Globalization and the Crisis of America’s Containerized Export Trade
By Jock O’Connell, Economist
Explore how America’s containerized export trade is facing a crisis amid slowing globalization—examining declining export volumes, shifting global demand patterns, and structural challenges reshaping U.S. supply chains and port competitiveness.
2025 Avocado, Nuts, and Wine Trade Volumes
Discover 2025 trade highlights for avocados, tree nuts (almonds, walnuts, pistachios), and bulk wine — including Mexico’s dominant role in U.S. avocado imports, export trends amid China trade disruptions, and resilient maritime wine shipment volumes through key gateways like the Port of Oakland.
San Pedro Bay Ports Container Dwell Times for November 2025
Container dwell times at the San Pedro Bay Port Complex remained consistent through November 2025, reflecting ongoing operational stability as the holiday season reached its peak. Both truck- and rail-destined cargo continued to move efficiently, supported by sustained coordination among marine terminal operators, drayage partners, and rail providers.

